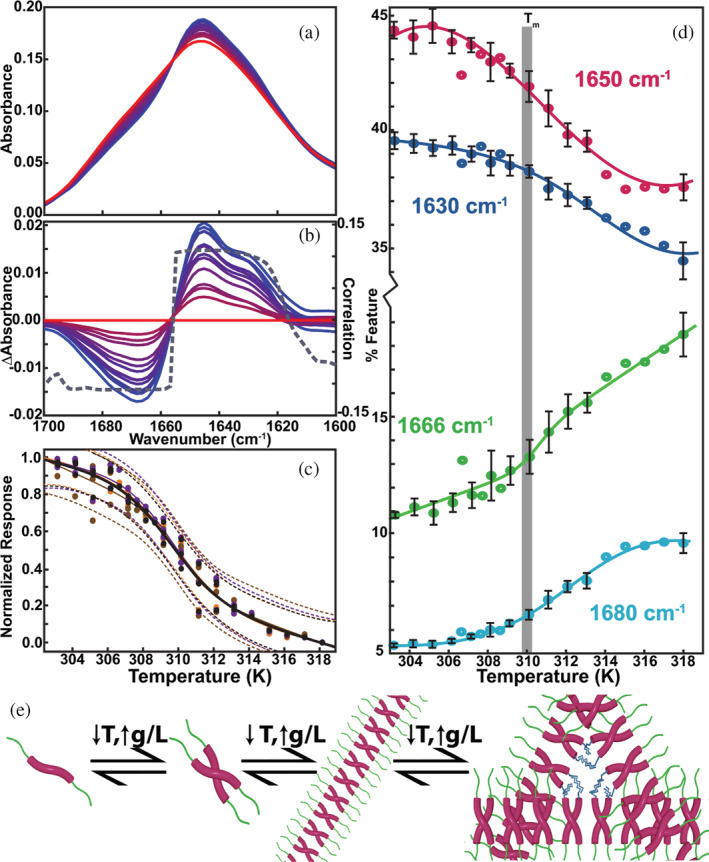
FIGURE 3.

(a) Spectra of a 50 g/L CAHS D from 303 K (blue) to 318 K (red). (b) Difference spectra relative to the 318 K spectrum and loading plot of the first principal component (PC1, gray curve). (c) Melting curves with two‐state fits constructed using absorbance data (orange, 1,502 cm−1; brown, 1,622 cm−1; purple, 1,644 cm−1) and PC1 (black) with 95% confidence intervals (dashes). (d) Calculated percentage of various features from iterative peak fitting of Voigt profiles. Conditions: 13.7 mM NaCl, 0.27 M KCl, 0.8 mM Na2HPO4, 0.2 mM KH2PO4, and pH 7.4 (e) Presumed model of gelation, from monomer to oligomers that form gelation‐competent fibrils. CAHS, cytosolic abundant heat soluble protein.
