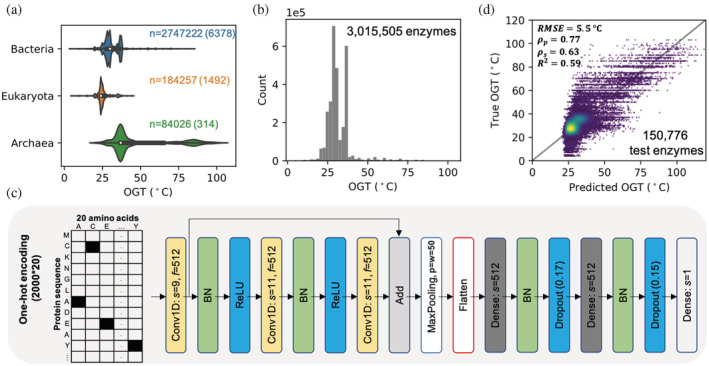
FIGURE 1.

Learning representations of enzyme thermal adaptation with DeepET. (a) OGT distribution of enzymes from three domains, where n indicates the number of enzymes from each domain and the number in the parentheses is the number of species where those enzymes are from. (b) The OGT distribution of all enzymes in the training data set. (c) Optimized architecture of deep neural networks used in this study, where s indicates the filter (kernel) size of convolutional layers and number of nodes for dense layers; f indicates the number of filters (kernels); p and w in the max pooling layer indicate the pool size and the length of the stride, respectively; the floating‐point number in a dropout layer indicates the dropout ratio; BN denotes Batch Normalization. The convolutional layers have padding set to “same,” while the max pooling has it set to “valid” (no padding). Layers use the ReLU activation function. (d) Comparison between predicted and true OGT values of enzymes in the hold out data set. RMSE, root mean squared error; , Pearson's correlation coefficient; , Spearman's correlation coefficient; R 2, coefficient of determination. OGT, optimal growth temperature
