Fig. 1.

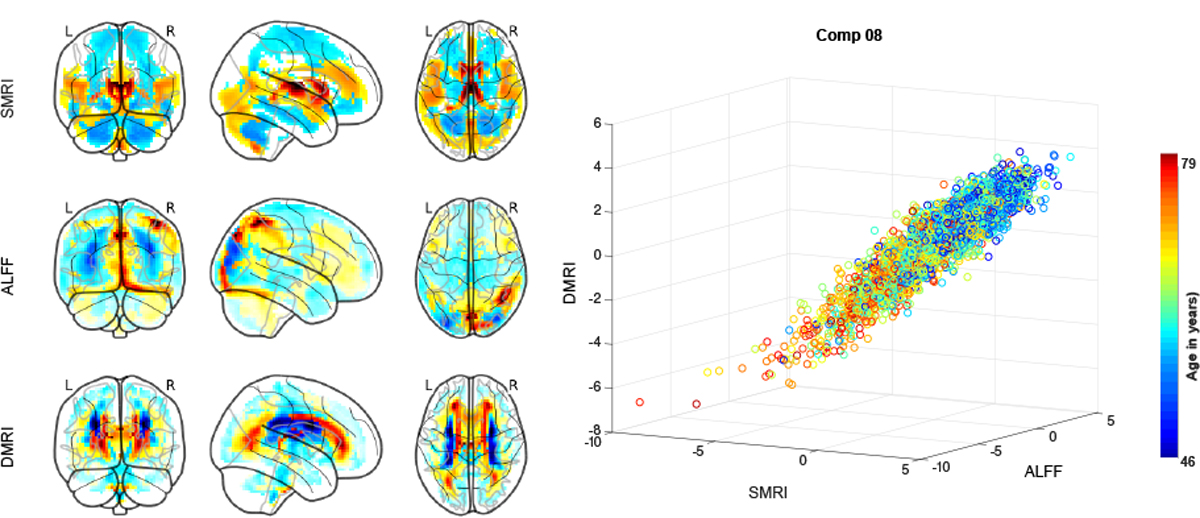
The sources corresponding to component 8 for each of the three modalities are plotted as scatter plot. Each point represents a subject color-coded by age. The component maps correspond to the mixing weights of the source for each modality.

The sources corresponding to component 8 for each of the three modalities are plotted as scatter plot. Each point represents a subject color-coded by age. The component maps correspond to the mixing weights of the source for each modality.