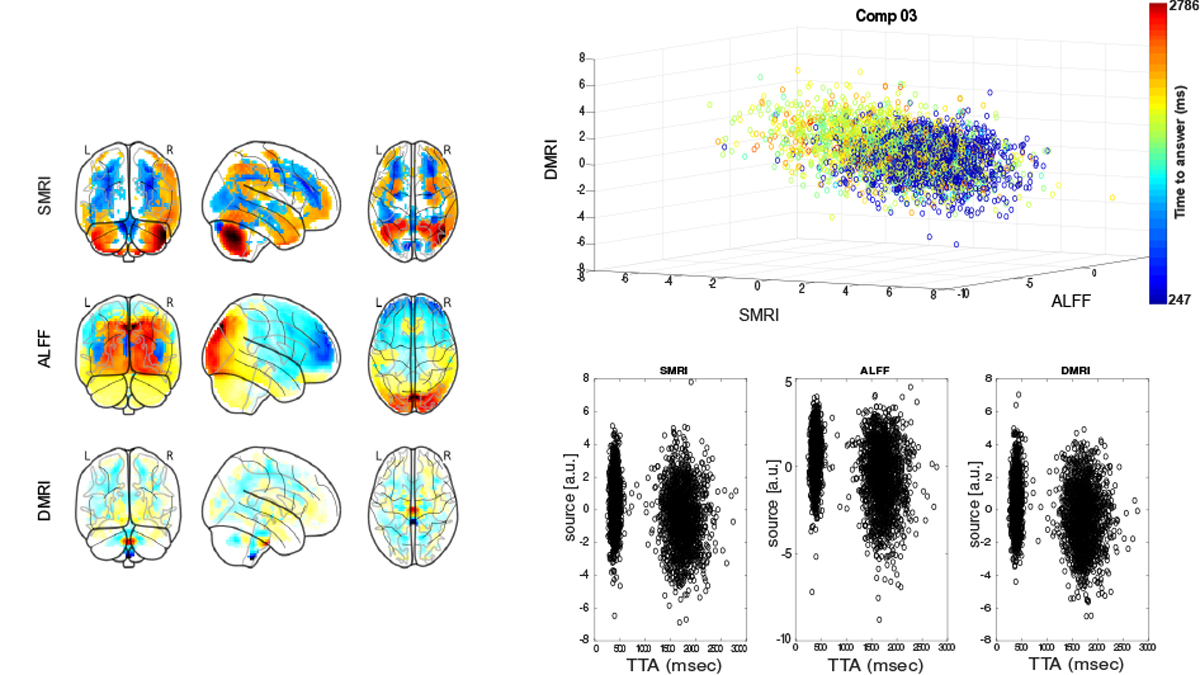
Fig. 3.

The sources corresponding to component 3 for each of the three modalities, plotted as scatter plot. Each point represents a subject color-coded by time-to-answer (TTA) in a prospective memory test. The component maps correspond to the mixing weights of the source for each modality. The source intensities are also plotted separately for each modality to show consistent shift in source distributions of fast and slow responders in prospective memory task.
