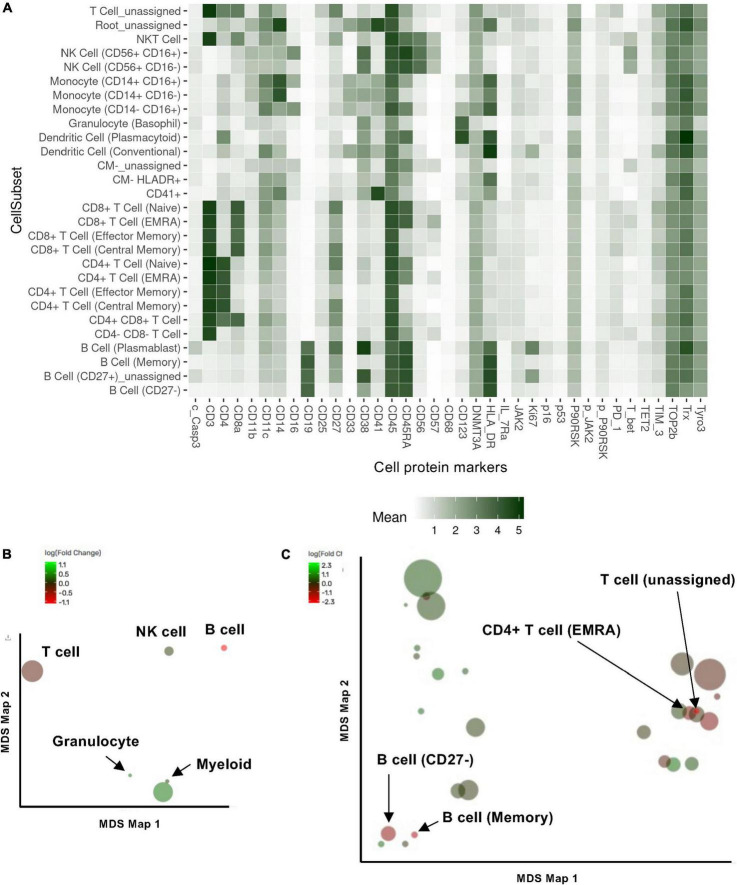
FIGURE 1.
Cell subset using the Astrolabe platform. The FlowSOM algorithm clustered cells and labeled subsets according to the canonical gating hierarchy. (A) Cell subset heat map. The rows represent cell subsets, and the columns represent cell protein expression. Tile intensity showed the median value in the subset according to the color key. (B,C) Multidimensional scaling (MDS) map for each cell type (B) and cell subsets clustered by Astrolabe platform as shown in (A). Each bubble represents a cell type (B) or subset (C), and the size of that bubble is determined by the median frequency of cells contained in that bubble across all samples analyzed. Each bubble is colored based on the magnitude of the fold change post-radiation therapy (RT) over baseline.

