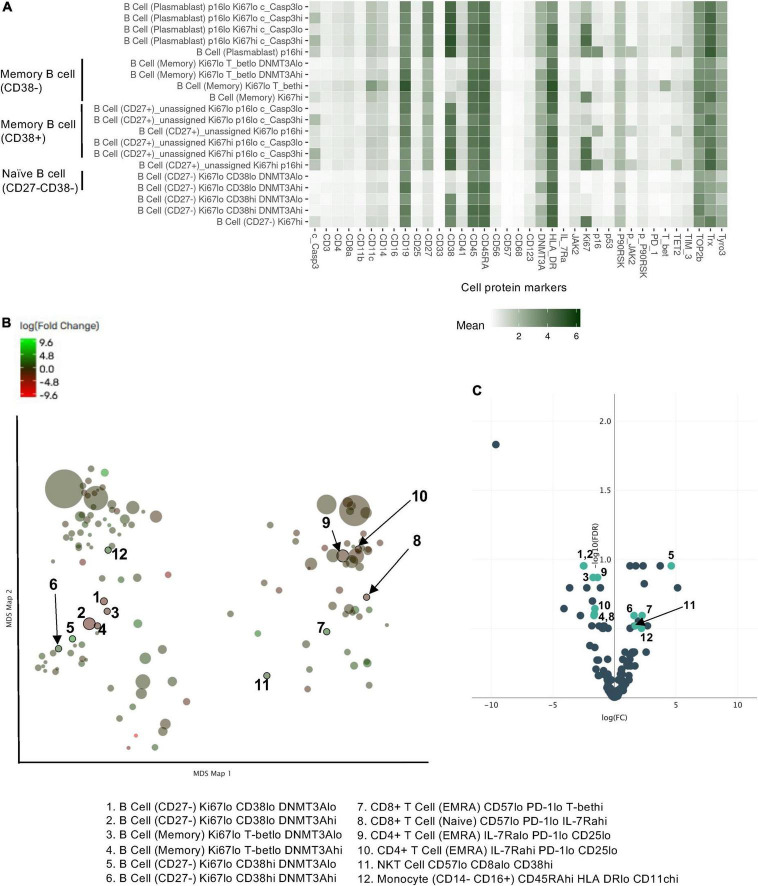
FIGURE 2.
Profiling subsets using the Astrolabe platform. (A) Profiling subset heat map for B cells only. Refer to Supplementary Figure 1 for the complete heat map. Rows are cell subsets; columns are channels. Tile intensity is the median value measured in each channel in each profiling. (B) Profiling of every cell cluster (138 clusters) was visualized using MDS. Each cluster is colored based on the logarithm of the ratio of intensity in the post-RT sample to pre-RT (baseline) sample. (C) A volcano plot of identified cell clusters profiled in (B), showing those with –log10 [the false discovery rate (FDR)] > 0.5, log(FC) < –1 or 1 < log(FC) and p < 0.05 (student’s t-test) after RT (pre-RT vs. post-RT as described in Figure 4A and Supplementary Figure 2) in light green. Once the frequency data within –log(FDR) > 0.5 and log[fold change (FC)] < –1 or 1 < log(FC) were considered as significant, 31 profiling subsets were changed by RT. Then 12 profiling subsets were picked out from the 31 subsets by student’s t-test.

