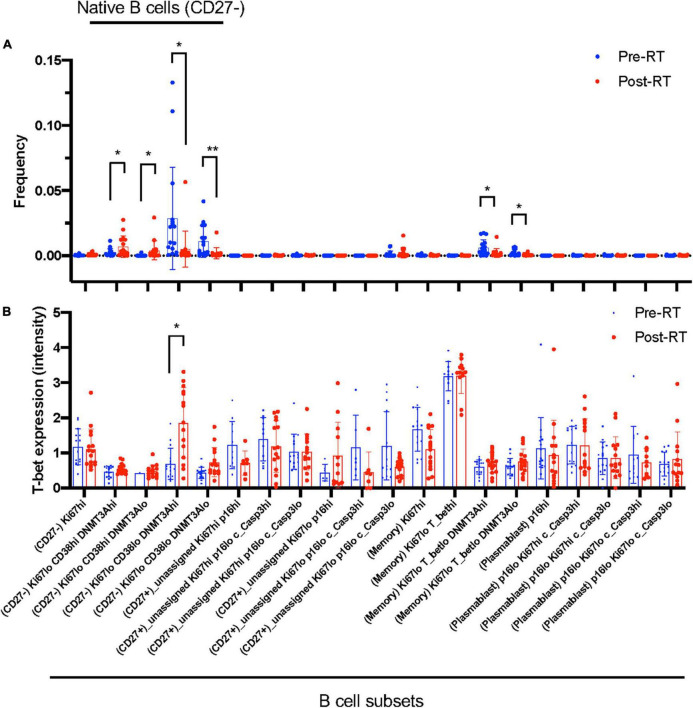
FIGURE 3.
B cell profiling subset and T-bet expression. (A) The frequency of each B cell profiling subset for all the cells in an experiment at pre-RT and post-RT. *p < 0.05 (or **p < 0.01) by Student’s t-test, –log(FDR) > 0.5 and log(FC) < –1 or 1 < log(FC). (B) T-bet expression in each B cell profiling subset. The significant increase of T-bet expression after RT was observed only in the Ki67–DNMT3a+ naïve B cell subset. Mean ± SD, *adj. P-Val < 0.05.

