FIGURE 4.
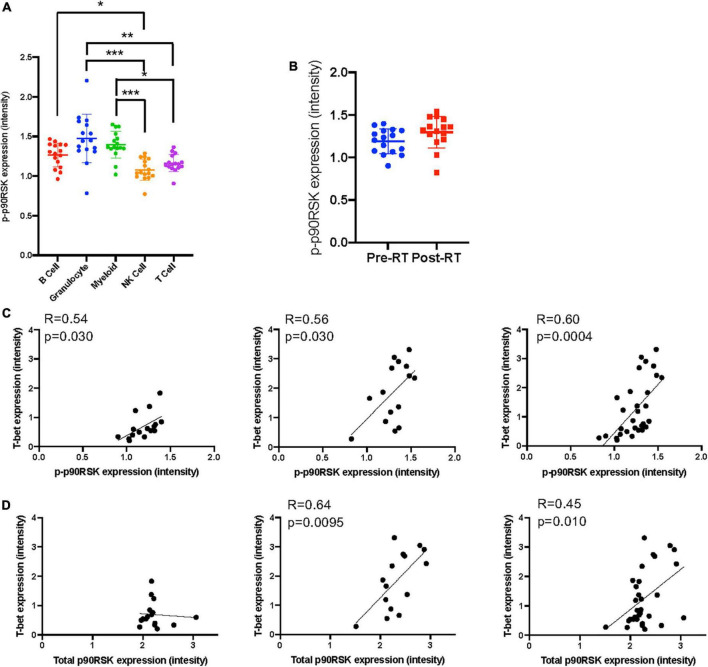
The relationship between T-bet and p90RSK in Ki67–DNMT3a+ naïve B cell subset. (A) p-p90RSK expression in each cell types. Mean ± SD, *p < 0.05, **p < 0.01, ***p < 0.001. Statistical significance was assessed by Dunn’s multiple comparisons test. (B) p-p90RSK expression in Ki67–DNMT3a+ naïve B cell subset showed no difference between pre-RT and post-RT. (C) The relationship between p-p90RSK and T-bet expression in Ki67–DNMT3a+ naïve B cell subset at pre-RT and post-RT. (D) The relationship between total p90RSK and T-bet expression in Ki67–DNMT3a+ naïve B cell subset at pre-RT and post-RT. Statistical significance and correlation were assessed by Pearson correlation.

