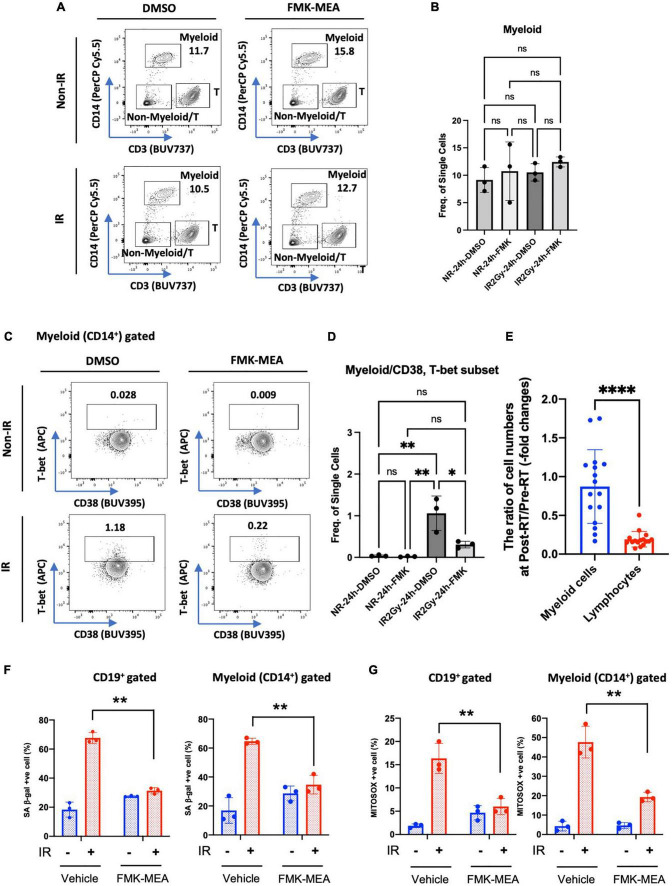
FIGURE 7.
IR-induced CD38+/T-bet+ myeloid cells via p90RSK activation. (A) Representative FACS plots of myeloid T-cell distribution are depicted. (B) Myeloid cell frequency 24 h after irradiation/non-irradiation with/without FMK-MEA (10 μM). (C,D) Representative FACS plots (C) and their frequency (D) of T-bet expression in CD14+ myeloid cells in each condition. N = 3 for each group, and the experiments were done more than twice. Mean ± SD, *p < 0.05 and **p < 0.01. (E) The ratio of cell numbers [myeloid cells (Blue) and lymphocytes (Red)] at pre-RT and post-RT. Mean ± SD, ****p < 0.001. (F,G) PBMCs were exposed to IR (2 Gy) with pre-treatment of FMK-MEA (10 μM) or vehicle for 1 hr. Senescent B cells and monocytes from PBMCs were measured using the C12FDG, a fluorogenic substrate for SA-β-galactosidase. Data shows the Quantification of positive C12FDG+ cells from CD19+ (Left) CD14+ (Right) cells. (G) Mitochondrial superoxide production was measured using the Mitosox dye in CD19+ (left) CD14+ (right) cells. Mean ± SD, n = 3, **p < 0.01.

