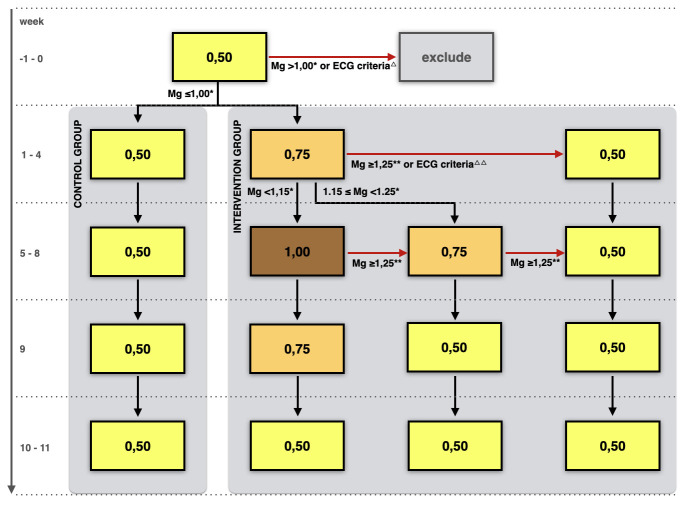
Figure 1.
Flow chart of the study intervention. Numbers within frames represent dialysate magnesium concentrations in mmol/L. All other magnesium concentrations represent plasma magnesium concentrations, also in mmol/L. Mg, magnesium; Δ, ECG criteria at baseline: bradycardia defined as heartrate <60 bpm or prolonged QTc interval >450 ms in male or >460 ms in female; ΔΔ, ECG criteria in week 4: bradycardia with heart rate <50 bpm or prolonged QTc interval >450 ms in male or >460 ms in female; *predialysis plasma Mg concentration after the long interdialytic interval; **plasma Mg concentration at any time point (predialysis and postdialysis measurements included).

