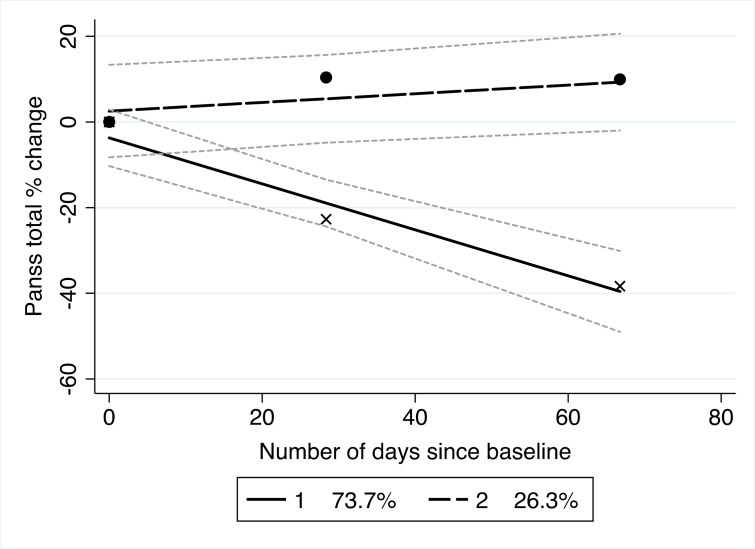
Figure 2.
Trajectory model of total PANSS score percentage change from baseline modelled over days since baseline assessment. The dotted linear trajectory reflects treatment non-responders and the complete line treatment responders. The grey dotted lines around each trajectory reflect the CIs for each trajectory group. Percentages reflect the estimated amount of the sampled population included in each trajectory. PANSS, Positive and Negative Syndrome Scale.

