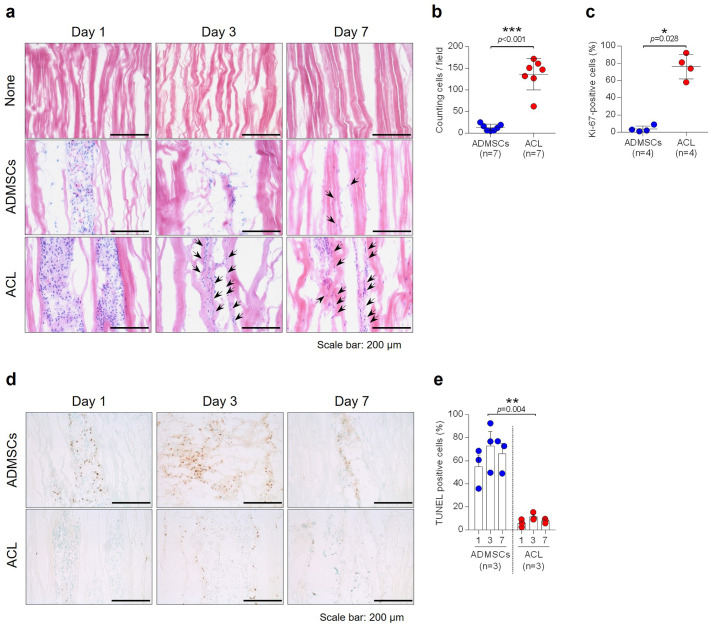
Fig. 2.
a) Each specimen was analyzed by haematoxylin and eosin (H&E) staining. Magnification ×200, scale bar 200 µm. Black arrows indicate the elongated cells that integrated into the matrix of tendon allografts. b) The number of elongated cells that integrated into the matrix was counted (n = 7). c) Proliferative cells were stained by Ki-67 and counted (n = 4). d) Apoptotic cells within cell-injected tendon allografts were stained by terminal deoxynucleotidyl transferase dUTP nick end labelling (TUNEL) assay. Magnification ×200, scale bar 200 µm. e) Quantification of Figure 2d (n = 3). *p < 0.05; **p < 0.01; ***p < 0.001, Mann-Whitney U test and one-way analysis of variance. Data are presented as the mean and standard deviation. ACL, anterior cruciate ligament; ADMSC, adipose-derived mesenchymal stem cell.

