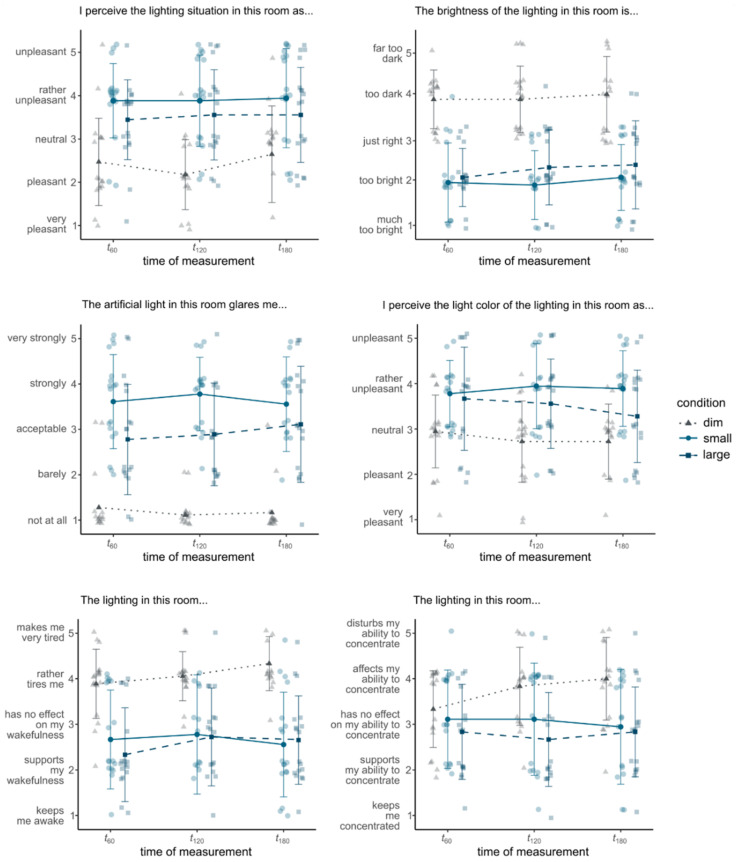
Figure A2.
Mean values of the ratings of the six scales of the VCQ. Statistical analysis reveals a significant main effect of condition for lighting situation, F1.40, 22.38 = 15.08, p < 0.001, η2 = 0.29, brightness, F2, 34 = 50.25, p < 0.001, η2 = 0.54, glaring, F2, 34 = 62.78, p < 0.001, η2 = 0.56, light color, F2, 34 = 10.77, p < 0.001, η2 = 0.20, effect on wakefulness, F2, 34 = 20.80, p < 0.001, η2 = 0.35, and effect on concentration, F1.44, 24.55 = 4.93, p = 0.02, η2 = 0.13. The error bars represent the standard deviation. The individual ratings are shaded.

