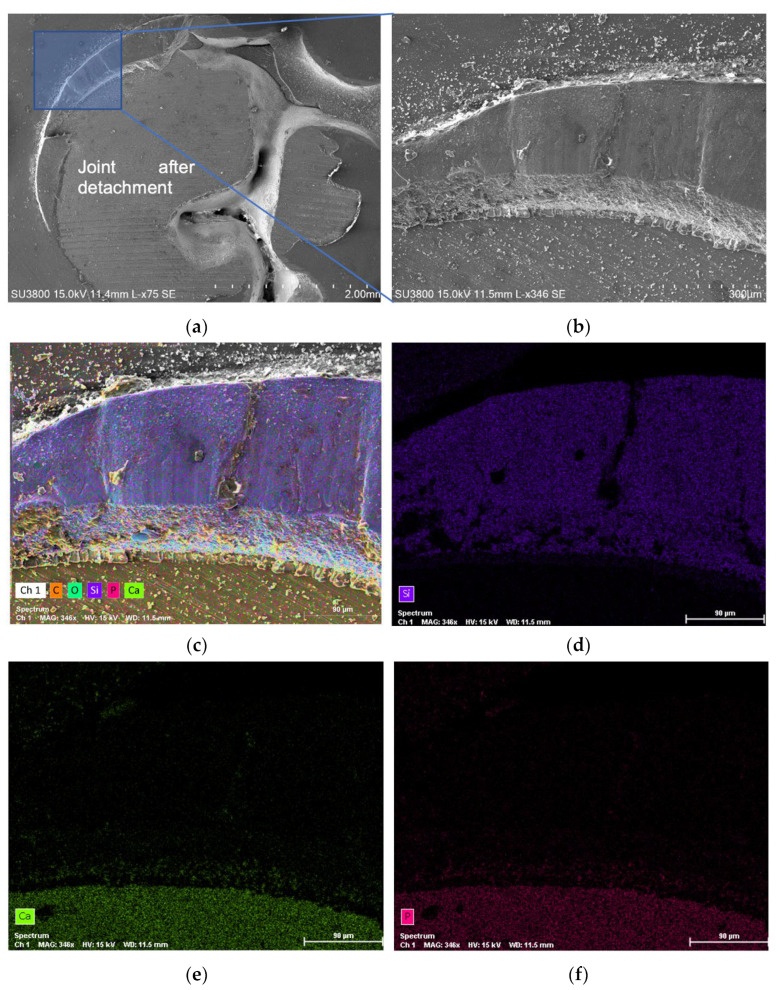
Figure 6.
SEM micrographs and EDS analysis after the shear bond strength test, for the control group, specimen C5, showing: (a) joint after detachment; (b) part of the composite resin that was left on the edges of the joint; (c) spectrum map of all the chemical elements; (d) Si spectrum identifying the composite resin region; (e) Ca spectrum identifying the dentin region; (f) P spectrum identifying the dentin region.

