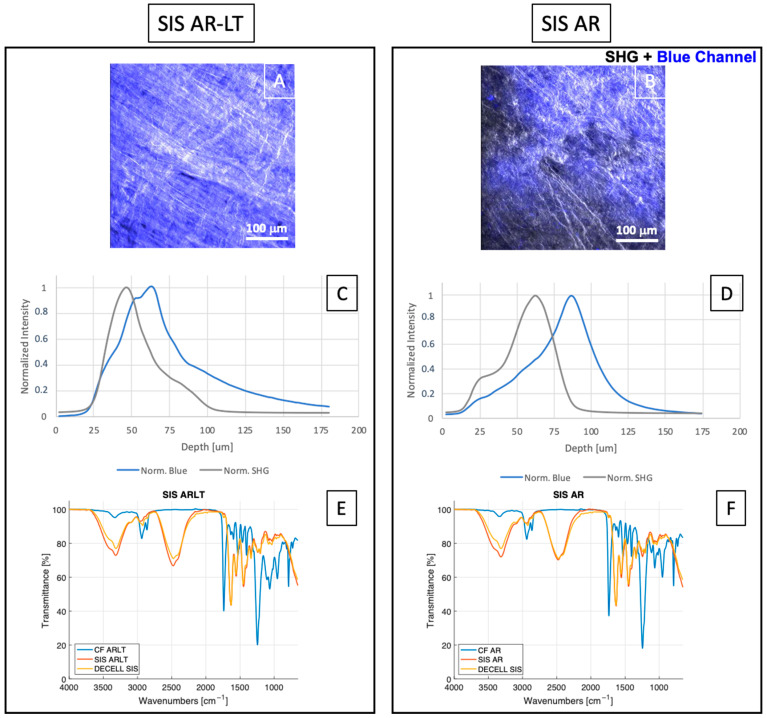
Figure 3.
Merge of z-stacks of phase contrast and autofluorescence (blue channel) images (A,B) of both hybrid membranes. Graphs of normalized intensities of SHG and blue channel for SIS AR-LT (C) and SIS AR (D). FTIR spectra of decellularized SIS, CF ARLT, and SIS AR-LT (E) and decellularized SIS, CF AR and SIS AR (F) are reported (n = 3 for each group), showing transmittance (%) over the wavenumbers (cm−1).

