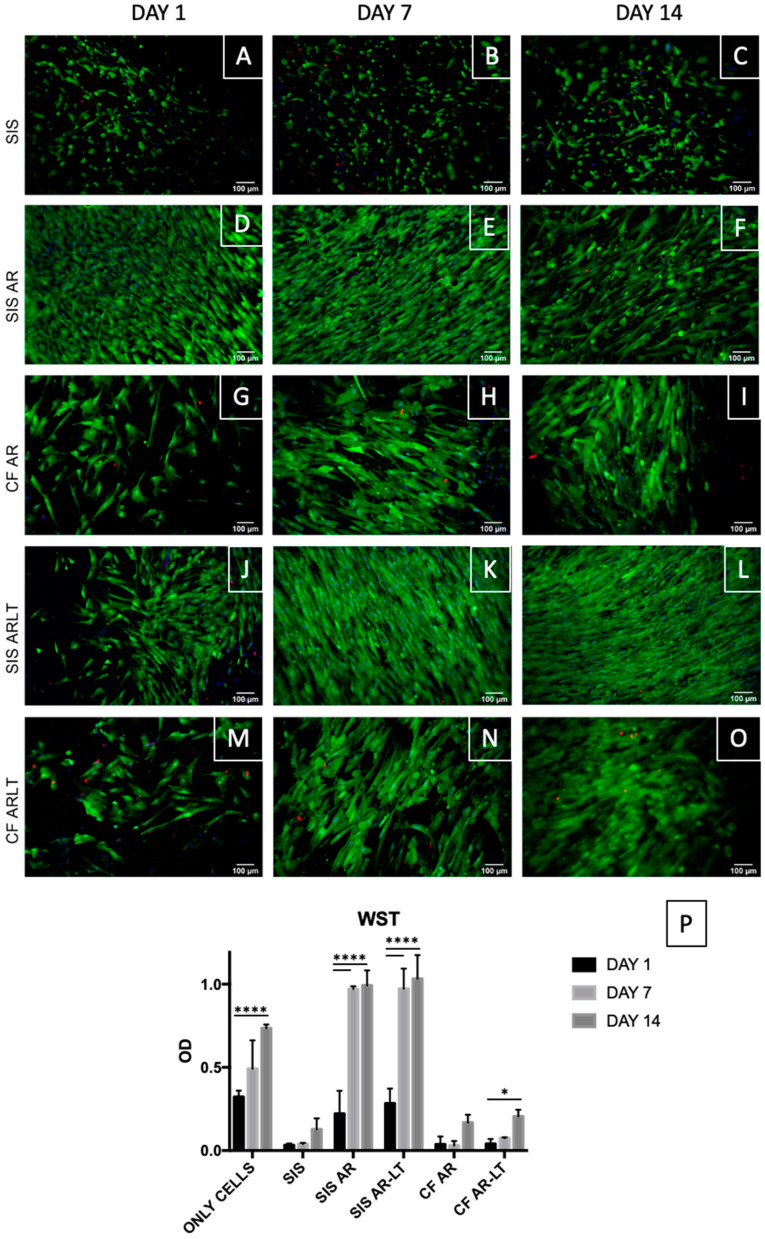
Figure 7.
Live/dead staining on seeded SIS, SIS AR, and SIS AR-LT and CF AR and CF AR-LT at days 1, 7, and 14 (A–O). Limited number of dead cells (in red) were found while an increase in live cells (in green) was found. Nuclei were stained with Hoechst in blue. Optical density values (OD) for SIS, SIS AR, and SIS AR-LT and CF AR and CF AR-LT are reported (n = 3) (P) showing a significant difference between days 1 and 14 in control group (only cells) and between days 1 and 7 and days 1 and 14 in both hybrid membranes using Dunnett’s multiple comparison test to compare day 7 and day 14 to day 1 (control). Data show mean ± SD, * p < 0,05, **** p < 0.0001.

