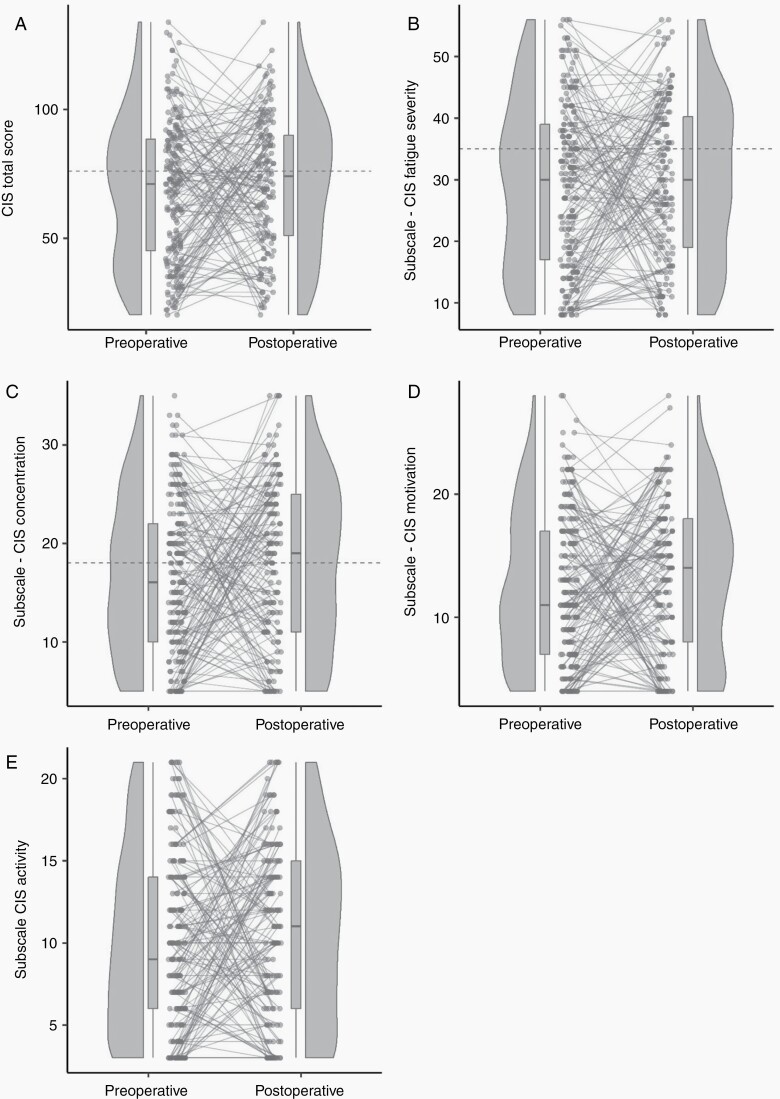
Figure 2.
Raincloud plots preoperative and postoperative checklist individual strength. Each panel shows a raincloud plot, which is a combination of a scatterplot, a boxplot with median and interquartile range, and half a violin plot.23 The grey lines between the dots of the scatterplots are combinations of scores of a preoperative and postoperative assessments within 1 patient. The grey dotted horizontal lines indicate the cut-off scores for the scales with available validated cut-off values. All panels include all assessments of the glioma cohort. (A) Reflects the checklist individual strength (CIS) total score. (B–E) Reflect the four CIS subscales. CIS, checklist individual strength.

