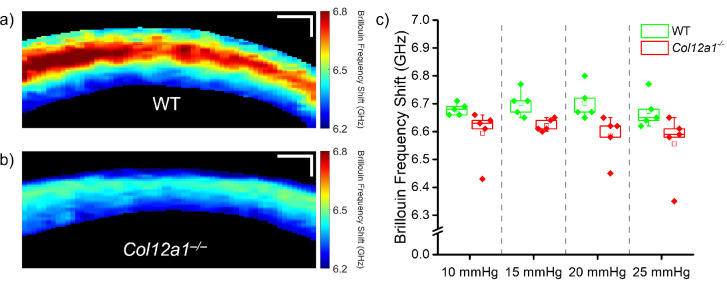
Figure 3.
Brillouin microscopy images of a representative (a) WT and (b) Col12a1–/– cornea at 10 mm Hg IOP. (c) Box and whisker plot of the Brillouin frequency shift for all measured samples (WT: N=5, and Col12a1–/–: N = 5), where the box represents the interquartile range (IQR), and the whiskers represent 1.5 times the IQR. Each points represents the mean sample Brillouin frequency shift. Scale bars: 100 µm.

