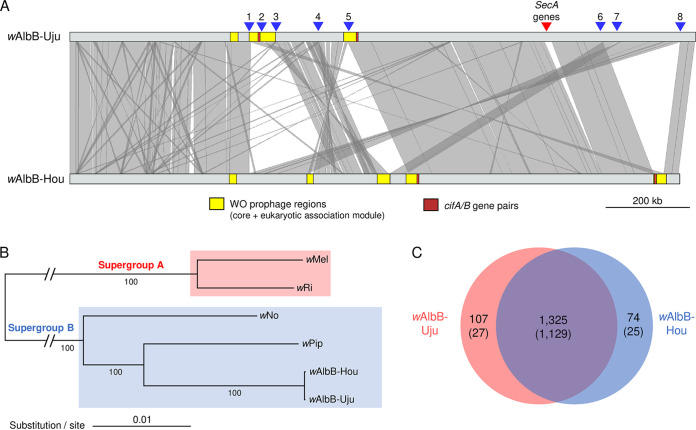
FIG 1.
Comparative analysis and phylogeny of wAlbB genomes. (A) Genome-wide synteny. Gray areas between genomes indicate similarities based on a megablastn comparison. BLAST hits and contigs of <3,000 bp were excluded from the figure, and genomes were rotated to start at the DnaA gene to improve visualization. Triangles indicate major chromosomal breakpoints (blue) and two syntenic putatively horizontally transferred SecA genes. (B) Maximum likelihood phylogeny using a concatenated alignment of 614 orthologous genes. Node labels are bootstrap supports calculated from 1,000 replications. (C) Venn diagram showing numbers of orthologues shared between wAlbB genomes. (Numbers in parentheses exclude transposable elements.)

