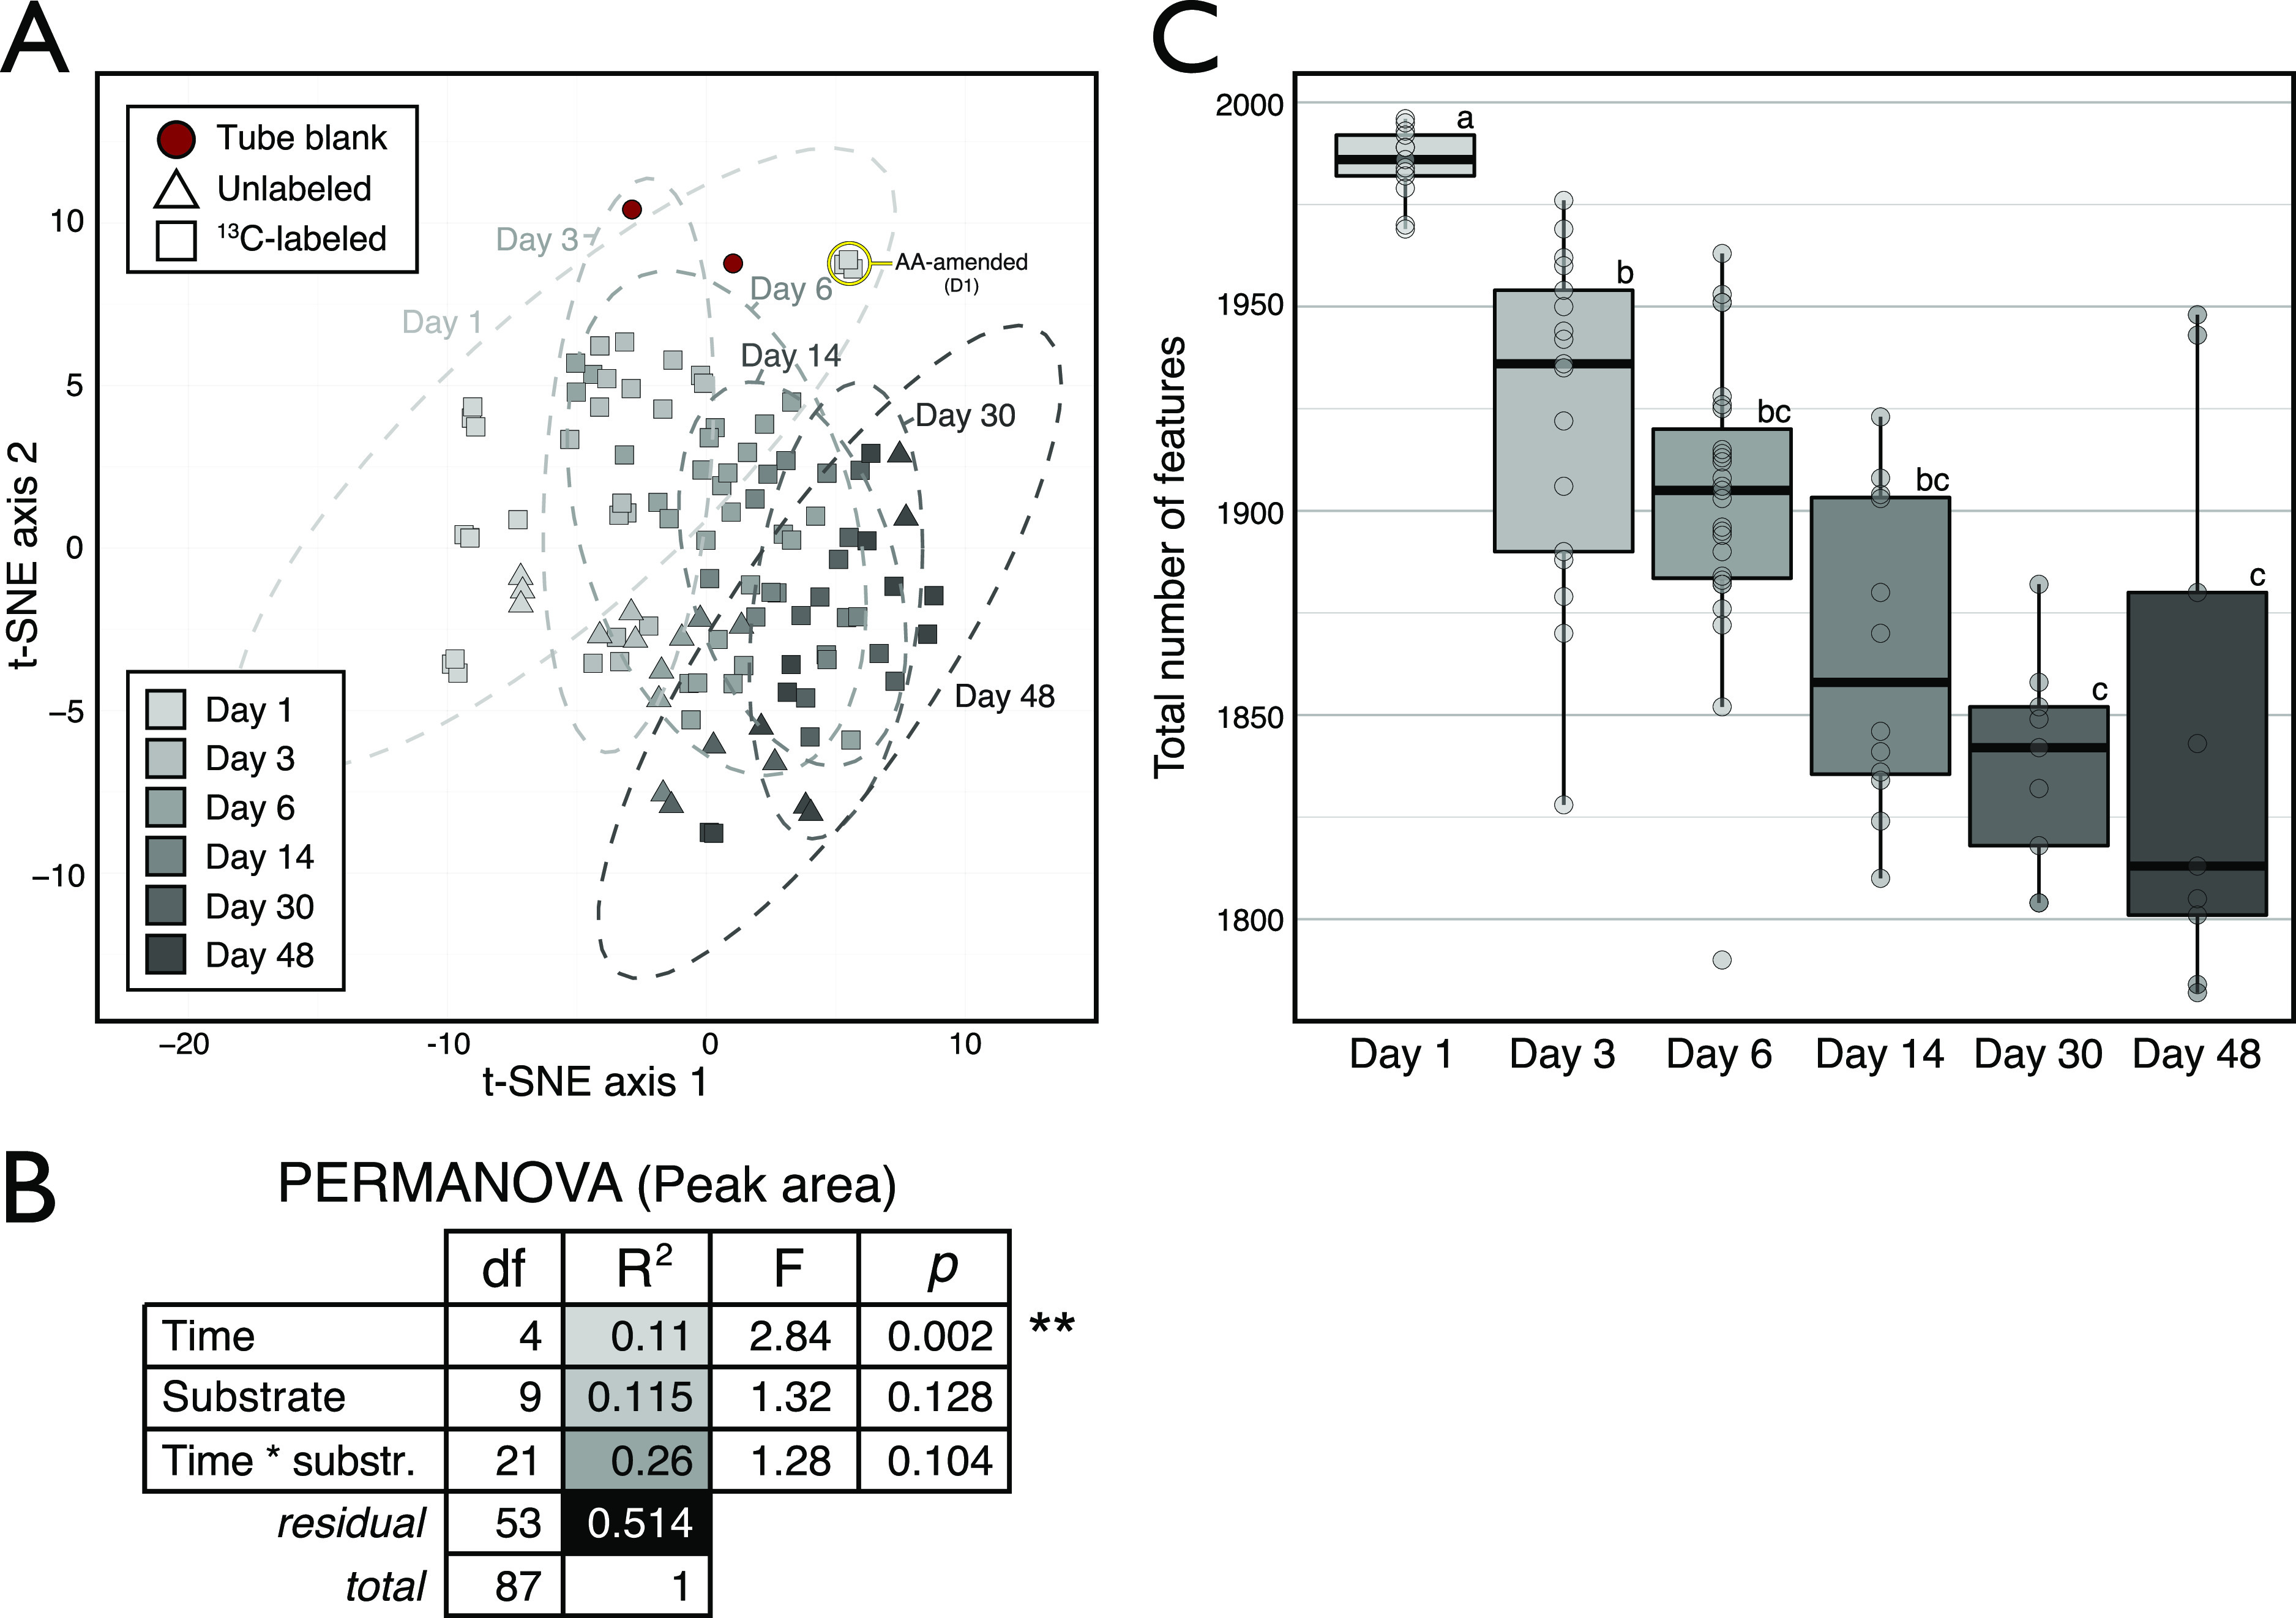
FIG 1.

Whole metabolite profiles varied primarily across time when compared based on the peak area of all identified metabolites in soil water extracts (n = 138), irrespective of their 13C enrichment. This result was expected, given that every amendment contained the whole set of carbon sources, varying solely by which single source was 13C-labeled. (A) Clustering of samples based on the t-SNE multidimension reduction algorithm, separated along the first axis according to time. The same temporal trend was apparent in untargeted features data shown in Fig. S1. (B) A permutational multivariate analysis of variance (PERMANOVA) showed that incubation time was the only significant factor explaining variation in weighted Bray-Curtis dissimilarity among metabolite profiles. Samples from day 1 were removed due to the distorting effect of 13C-labeled amino acids (highlighted in panel A). (C) The total number of features identified in the untargeted analysis decreased over time.
