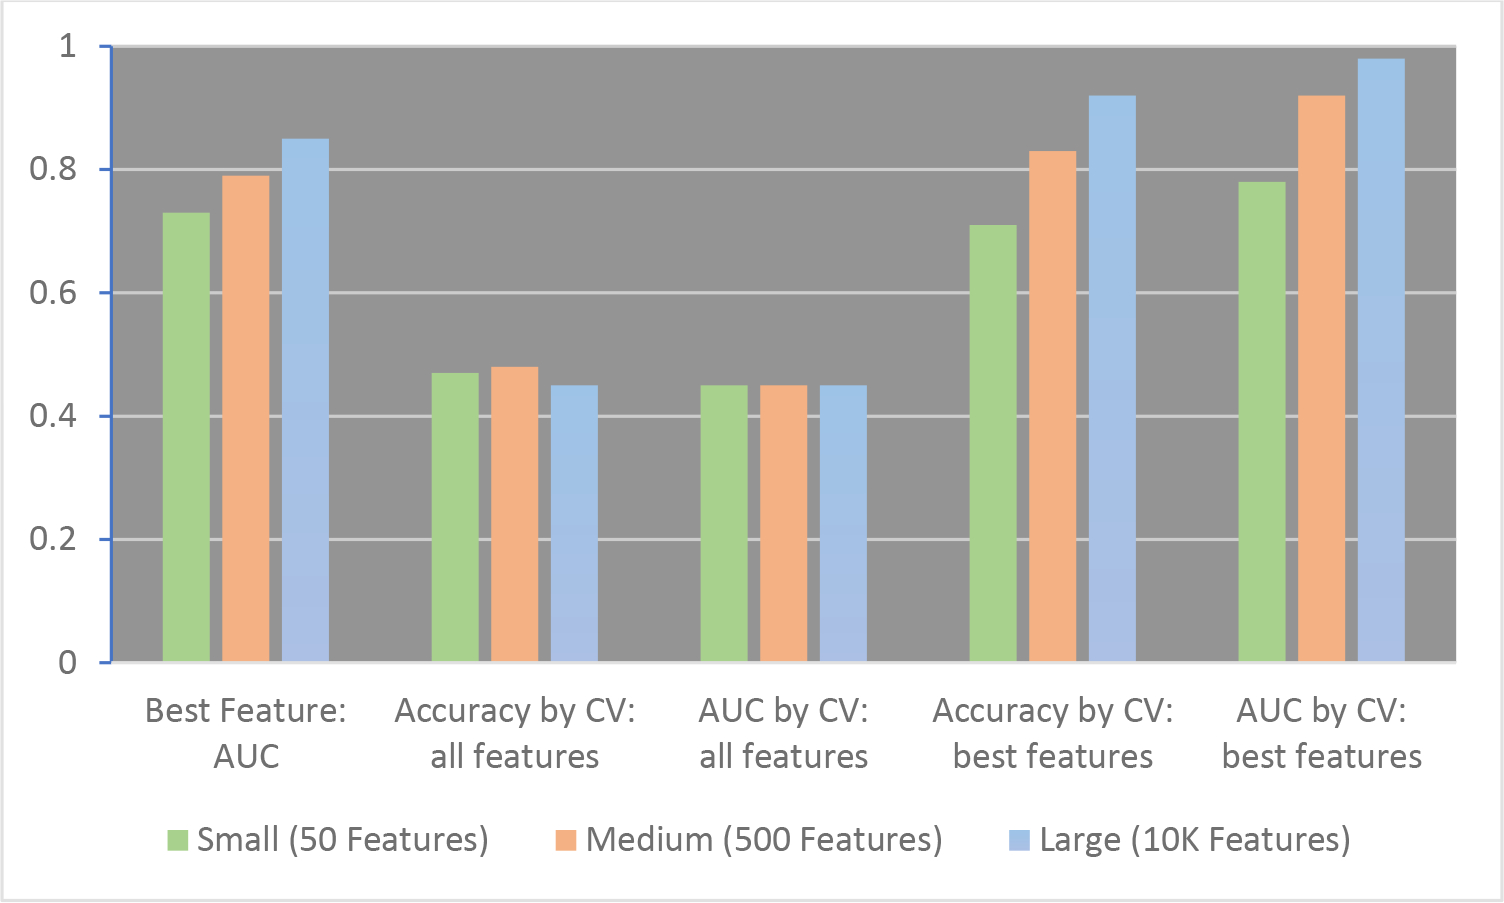
Figure 1.

Assigning Disease State Using Radom Numbers: Accuracy and AUC Under Different Conditions. Left to right: The maximum AUC for a single feature in the small (green), medium (orange) and large (blue) data sets is shown (Best Feature AUC). Accuracy by CV and AUC by CV: When all features are used and a classification model is tested by cross-validation (CV), (second and third sets of bars), the accuracy and AUC of the model are ~50%, which is expected for a dataset of random numbers. Fourth and fifth sets of bars: When only the best features are used, both the Accuracy by CV (cross-validation) and the AUC by CV are inappropriately high. All values are generated by averaging results from 50 data sets of random numbers; full details provided in Supplemental Materials.
