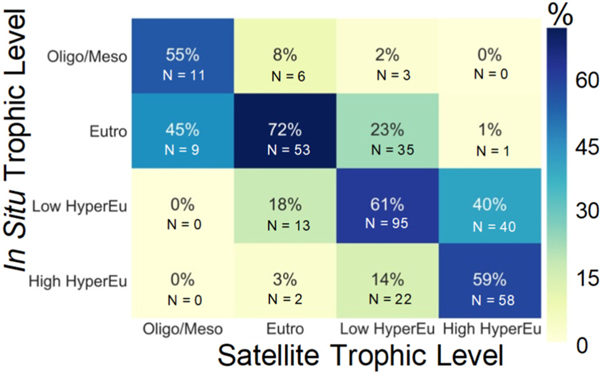
Fig. 8.
Confusion matrix percentages to illustrate the frequency of which the algorithm, ChlBS, predicts the trophic status of the in situ sample placed into 4 broad categories of oligotrophic/mesotrophic (0–7 μg L−1), eutrophic (7–30 μg L−1), low hypereutrophic (30–90 μg L−1), and high hypereutrophic (> 90 μg L−1).

