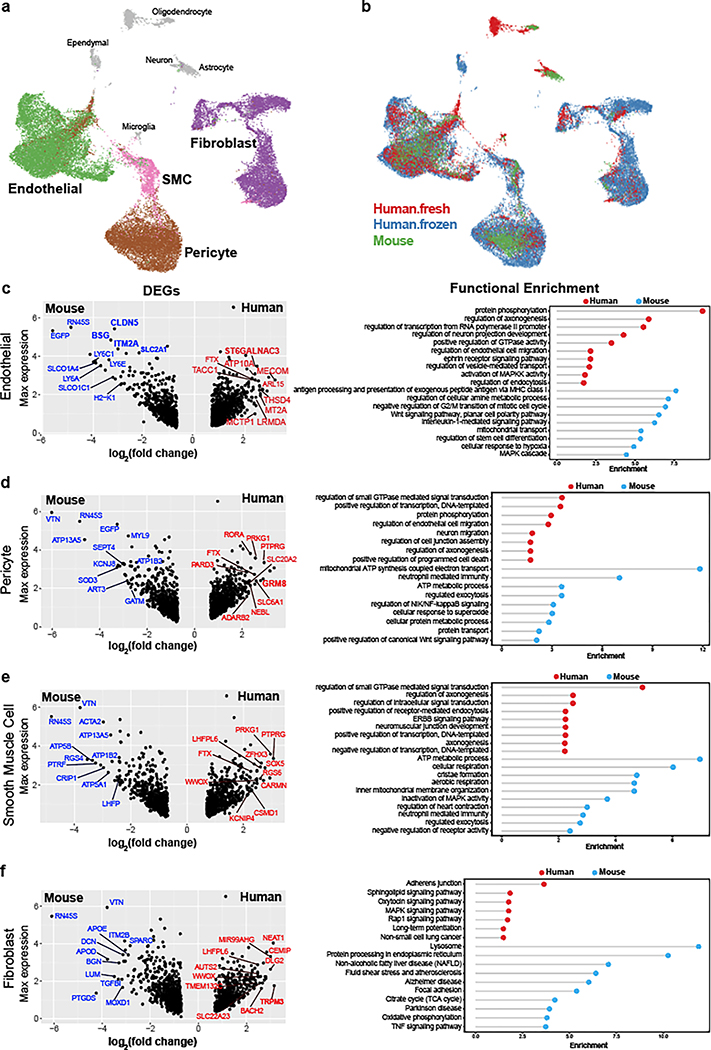
Figure 2. Integrative analysis of human ex vivo, post mortem, and mouse cerebrovascular cell types.
a-b. UMAP visualization of integrated cells from human ex vivo, human post mortem and mouse, coloring by cell types (a) and data source (b). All vessel-coupled cells were colored in grey. c-f. Differentially expressed genes between human and mouse in endothelial (c, left), pericyte (d, left), smooth muscle cells (e, left), and fibroblast (f, left). X-axis represents the log-transformed fold change and y-axis represents the maximal expression level. The top 20 genes are highlighted in blue for mouse and red for human. Genes that were also cell type markers are bolded. c-f. (right panels), the representative functional enriched terms of human- and mouse-specific/highly expressed genes.

