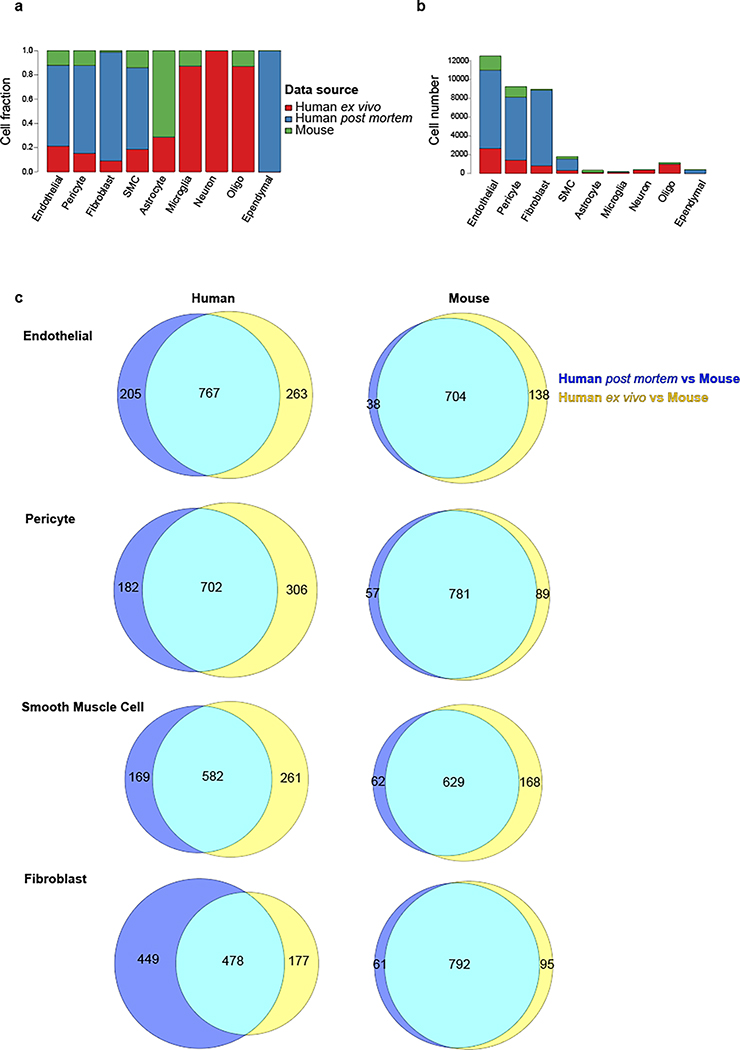
Extended Data Figure 3. Integrative analysis of ex vivo, post mortem, and mouse datasets.
a. Cell fraction distribution of single nuclei across all datasets by cerebrovasculature cell type. b. Cell number distribution of single nuclei across all datasets by cerebrovasculature cell type. c. Venn diagram overlaps of genes between human post mortem vs. mouse and human ex vivo vs. mouse.

