
Figure 4. Loss of INTS11 stimulates transcription of short RNAs.
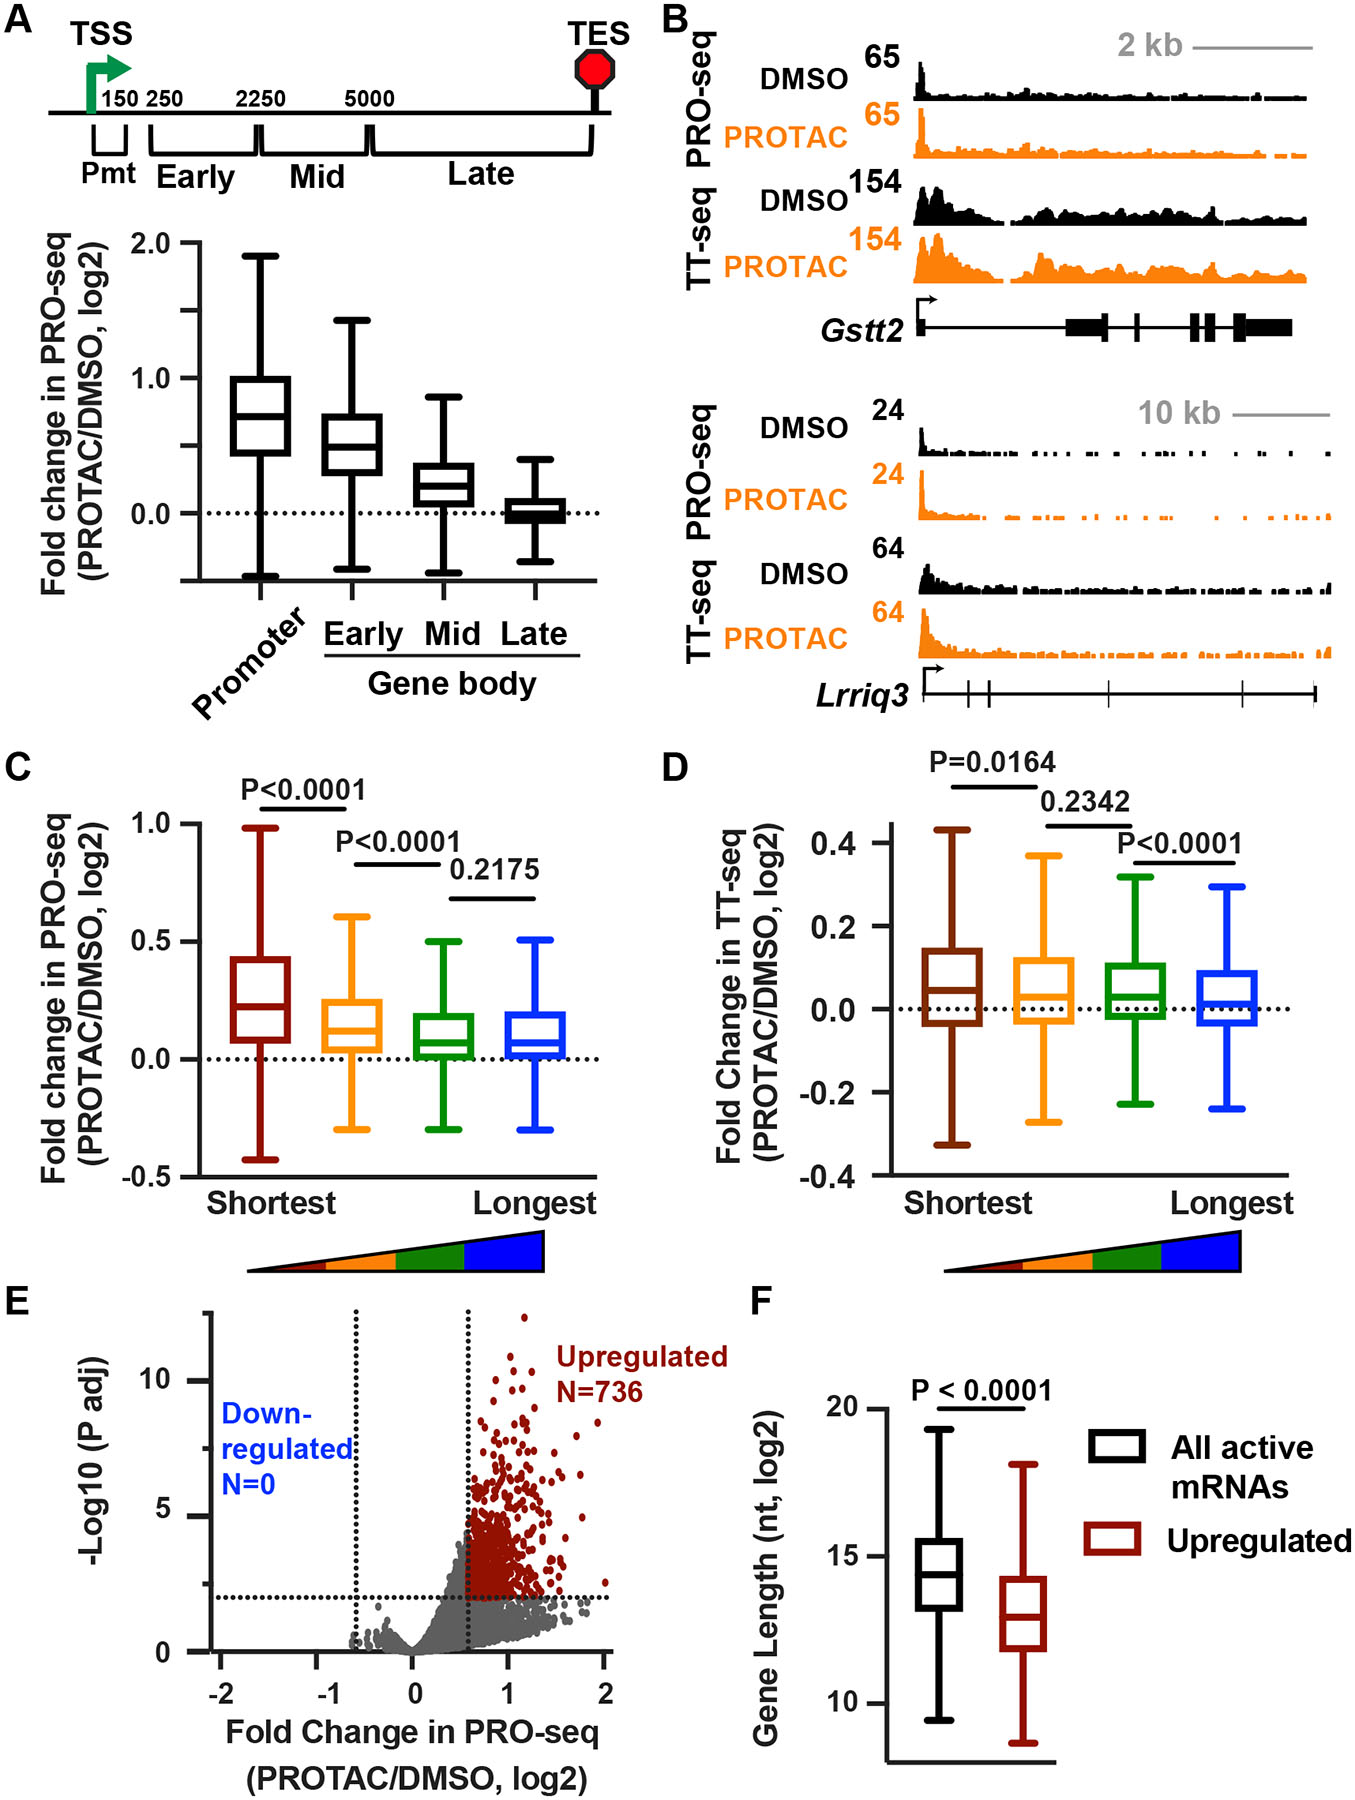
(A) Schematic at top depicts locations of windows across mRNA genes >10 kb (N=9,468) with respect to the TSS. Boxplots show the fold change in PRO-seq reads in each window.
(B) Browser shots of example genes that are short (top) or long (bottom).
(C) Shown is the change in gene body (+250 nt to TES) PRO-seq signal after PROTAC treatment for mRNAs (N=13,057) divided into length quartiles. P values from Mann-Whitney test.
(D) The change in gene body TT-seq signal (exonic reads from +250 nt to TES) after PROTAC treatment for mRNAs divided into length quartiles as in C. P values from Mann-Whitney test.
(E) Volcano plot shows fold changes and adjusted P values for active mRNA genes (N=13,057), counting PRO-seq reads from TSS to TES. Affected genes are those with fold change > 1.5 and P adj < 0.01.
(F) Boxplots depict the gene lengths of all (N=13,057) or significantly upregulated (N=736) mRNAs. P value from Mann-Whitney test.
In A, C, and D, boxes show 25th–75th percentiles and whiskers depict 1.5 times the interquartile range.