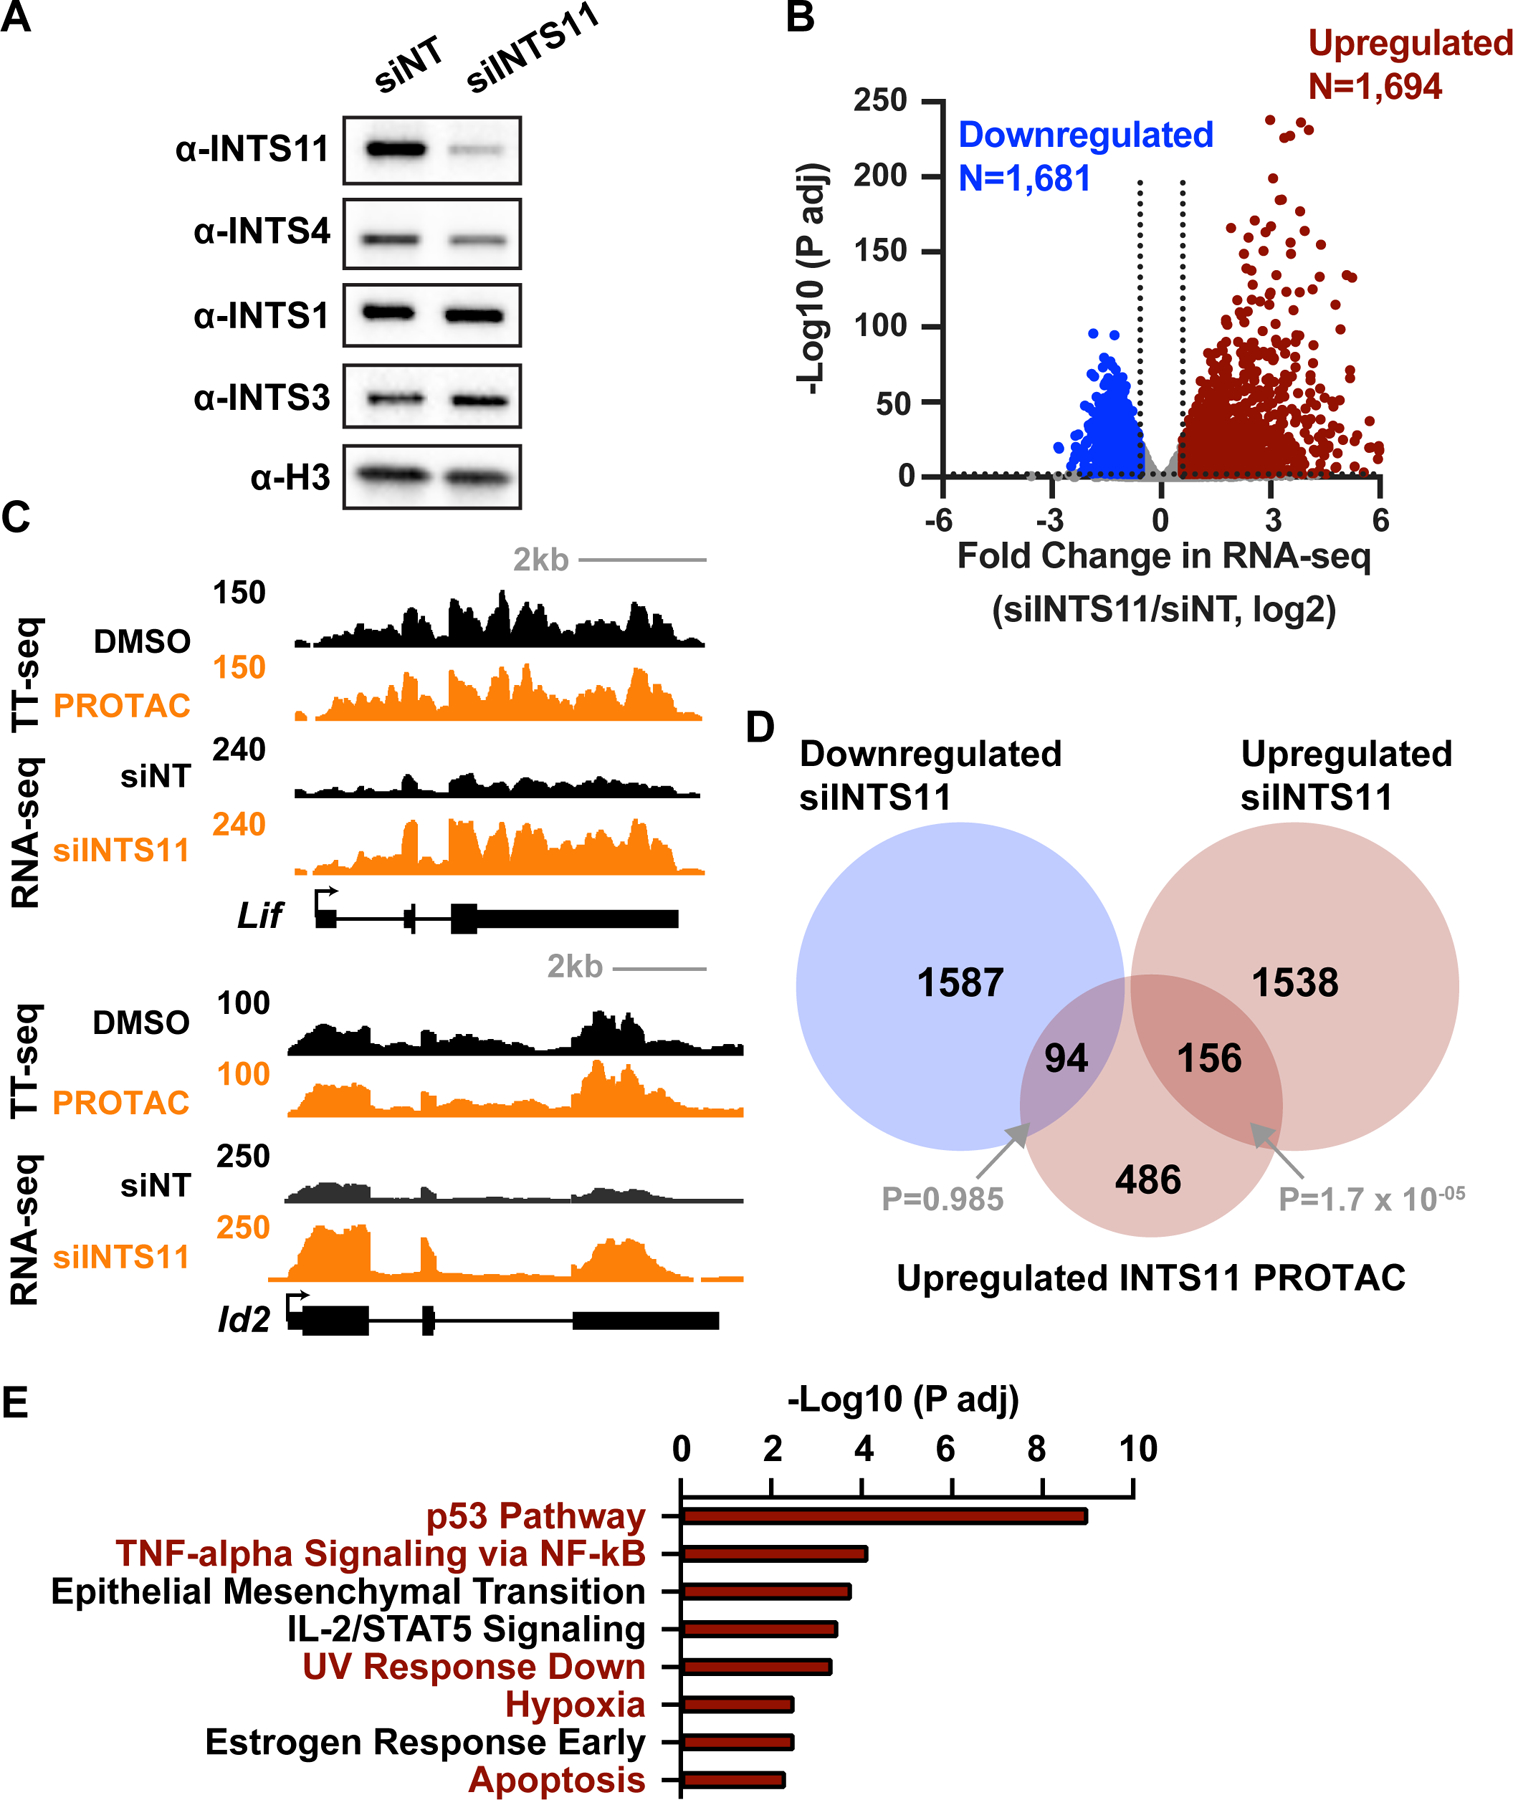
Figure 5. Similar pathways affected by acute INTS11 loss and long-term INTS11 depletion.

(A) mESCs were treated with non-targeting (siNT) or INTS11-targeting (siINTS11) siRNA for 48 h and harvested for western blots. Histone H3 is a loading control.
(B) Gene expression levels in cells depleted of INTS11 with siRNA as compared to siNT using total RNA-seq (n=3 per condition). Volcano plot shows fold changes and adjusted P values for active mRNA genes that did not display changes in RNA splicing (N=10,871). Affected genes are those with a fold change > 1.5 and P adj < 0.01.
(C) Example browser shots of (top) Lif, which is upregulated in RNA-seq from cells treated with INTS11 siRNA (48 h), but not TT-seq following INTS11 PROTAC treatment (4 h), and (bottom) Id2, which is upregulated under both conditions.
(D) Venn diagram depicting the overlap of genes affected by acute (4 h) INTS11 degradation vs. longer term INTS11 loss (48 h siRNA). P values for overlap were determined by hypergeometric test.
(E) Gene Ontology (GO) analysis of 1,694 mRNA genes upregulated upon siINTS11, as defined in B. MSigDB terms with P adj < 0.05 are shown. Terms in red were also found in GO analysis of upregulated genes from PRO-seq, as in Figure S4B.
