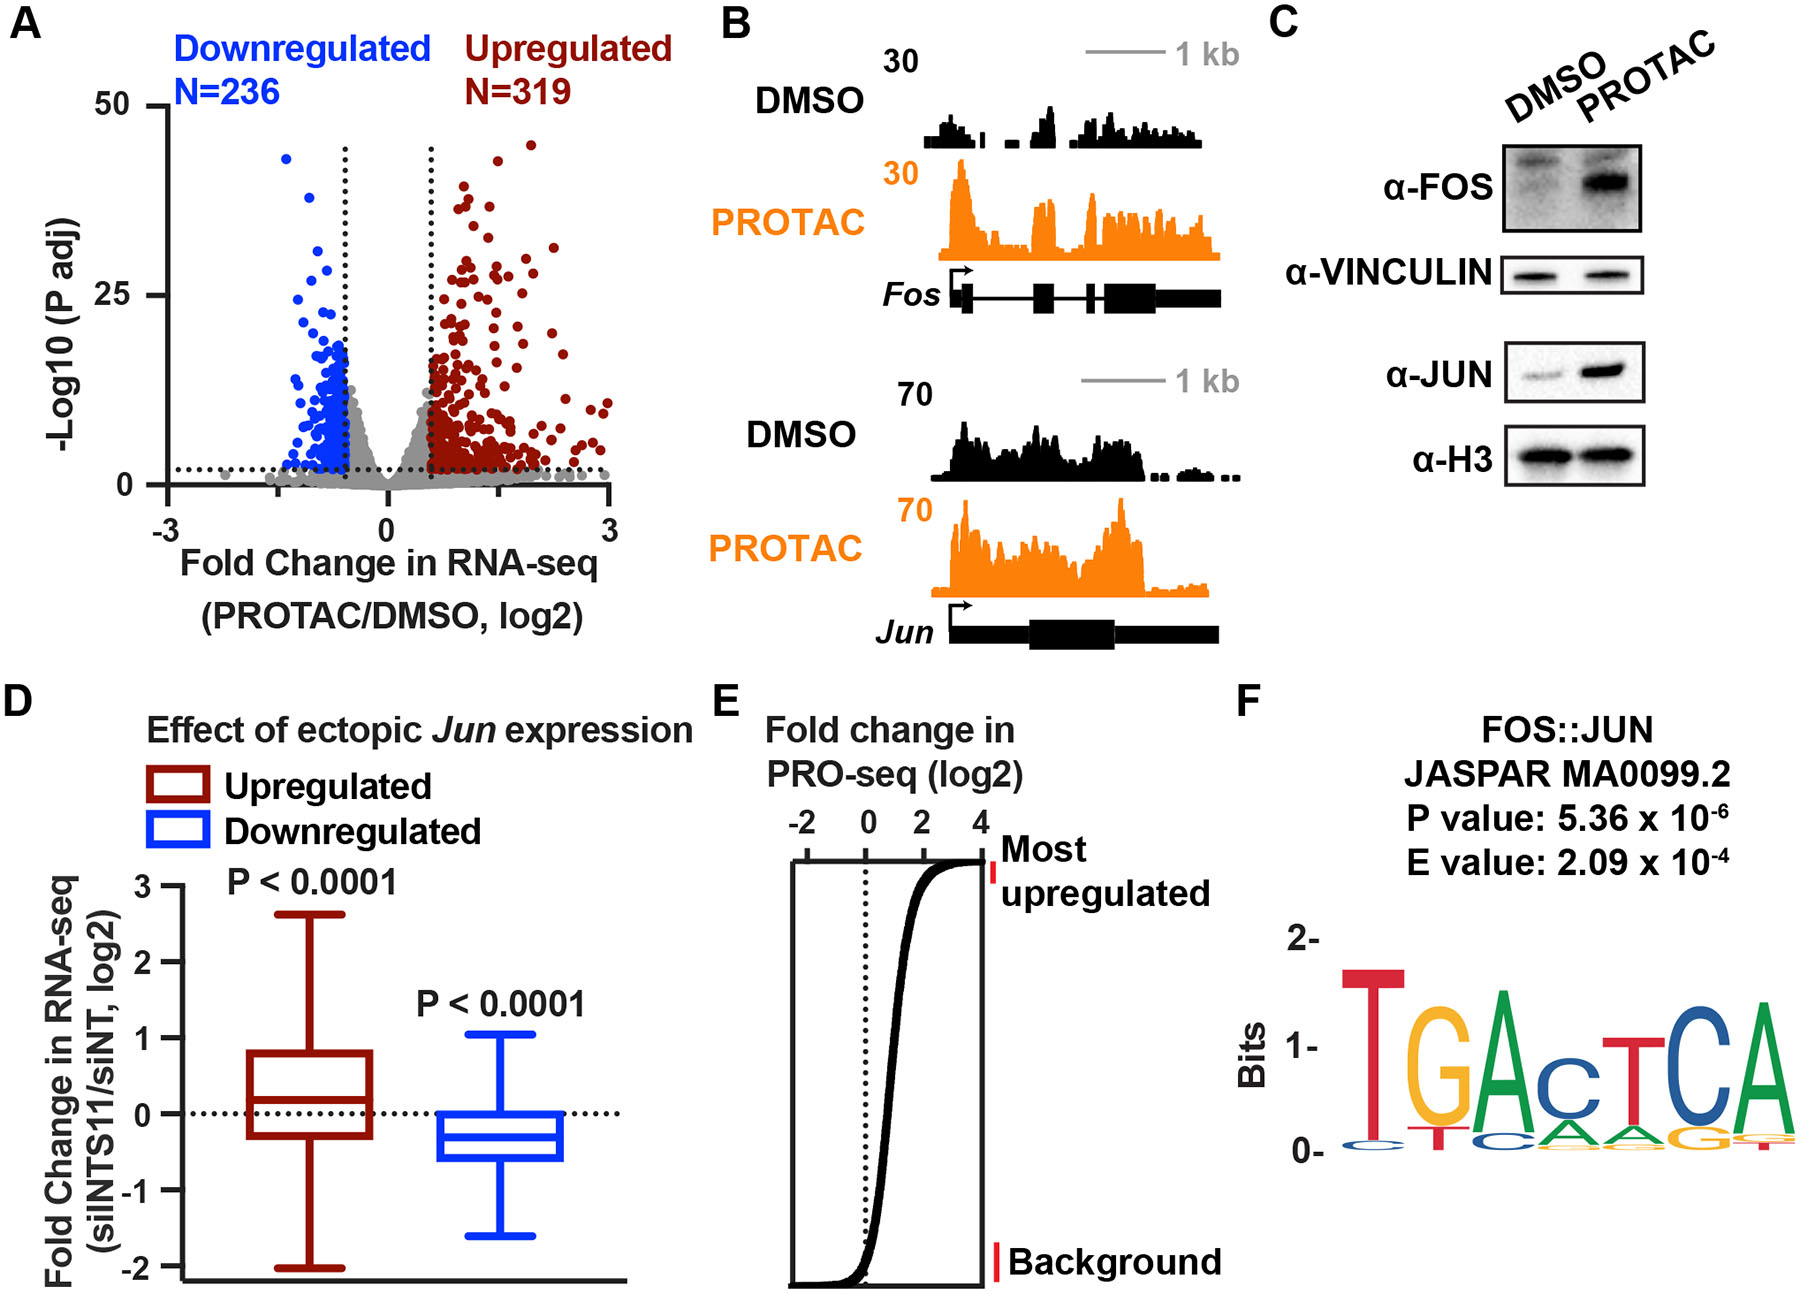
Figure 6. Sustained upregulation of FOS and JUN transcription factors activates AP-1 transcriptional program in INTS11 depleted cells.

(A) Gene expression levels in cells depleted of INTS11 with PROTAC for 16 h as compared to DMSO, using total RNA-seq (n=3 per condition). Volcano plot shows fold changes and adjusted P values for active mRNA genes shown in Figure 5B (N=10,871). Affected genes are those with a fold change > 1.5 and P adj < 0.01.
(B) RNA-seq browser shots of Fos and Jun from cells treated with DMSO or PROTAC for 16 h.
(C) Western blot from lysates of INTS11Halo cells treated with PROTAC or DMSO for 24 h. Vinculin and Histone H3 are loading controls.
(D) Boxplots depict fold change in RNA-seq after 48 h of siINTS11 for genes upregulated (N=1,000) or downregulated (N=903) by ectopic Jun expression in mESCs (Liu et al. 2015). Boxes show 25th–75th percentiles and whiskers depict 1.5 times the interquartile range. P value from Wilcoxon signed-rank test using a theoretical median of 0.
(E) Enhancers are rank ordered based on fold change in PRO-seq in the eTSS to +150 nt window. Lines at right indicate groups of enhancers used for motif search, comparing the 500 most upregulated enhancers to 1,000 unaffected enhancers.
(F) The motif most significantly enriched at highly upregulated enhancers after INTS11 depletion is for AP-1. Sequences 200 bp upstream of each enhancer TSS were used.
