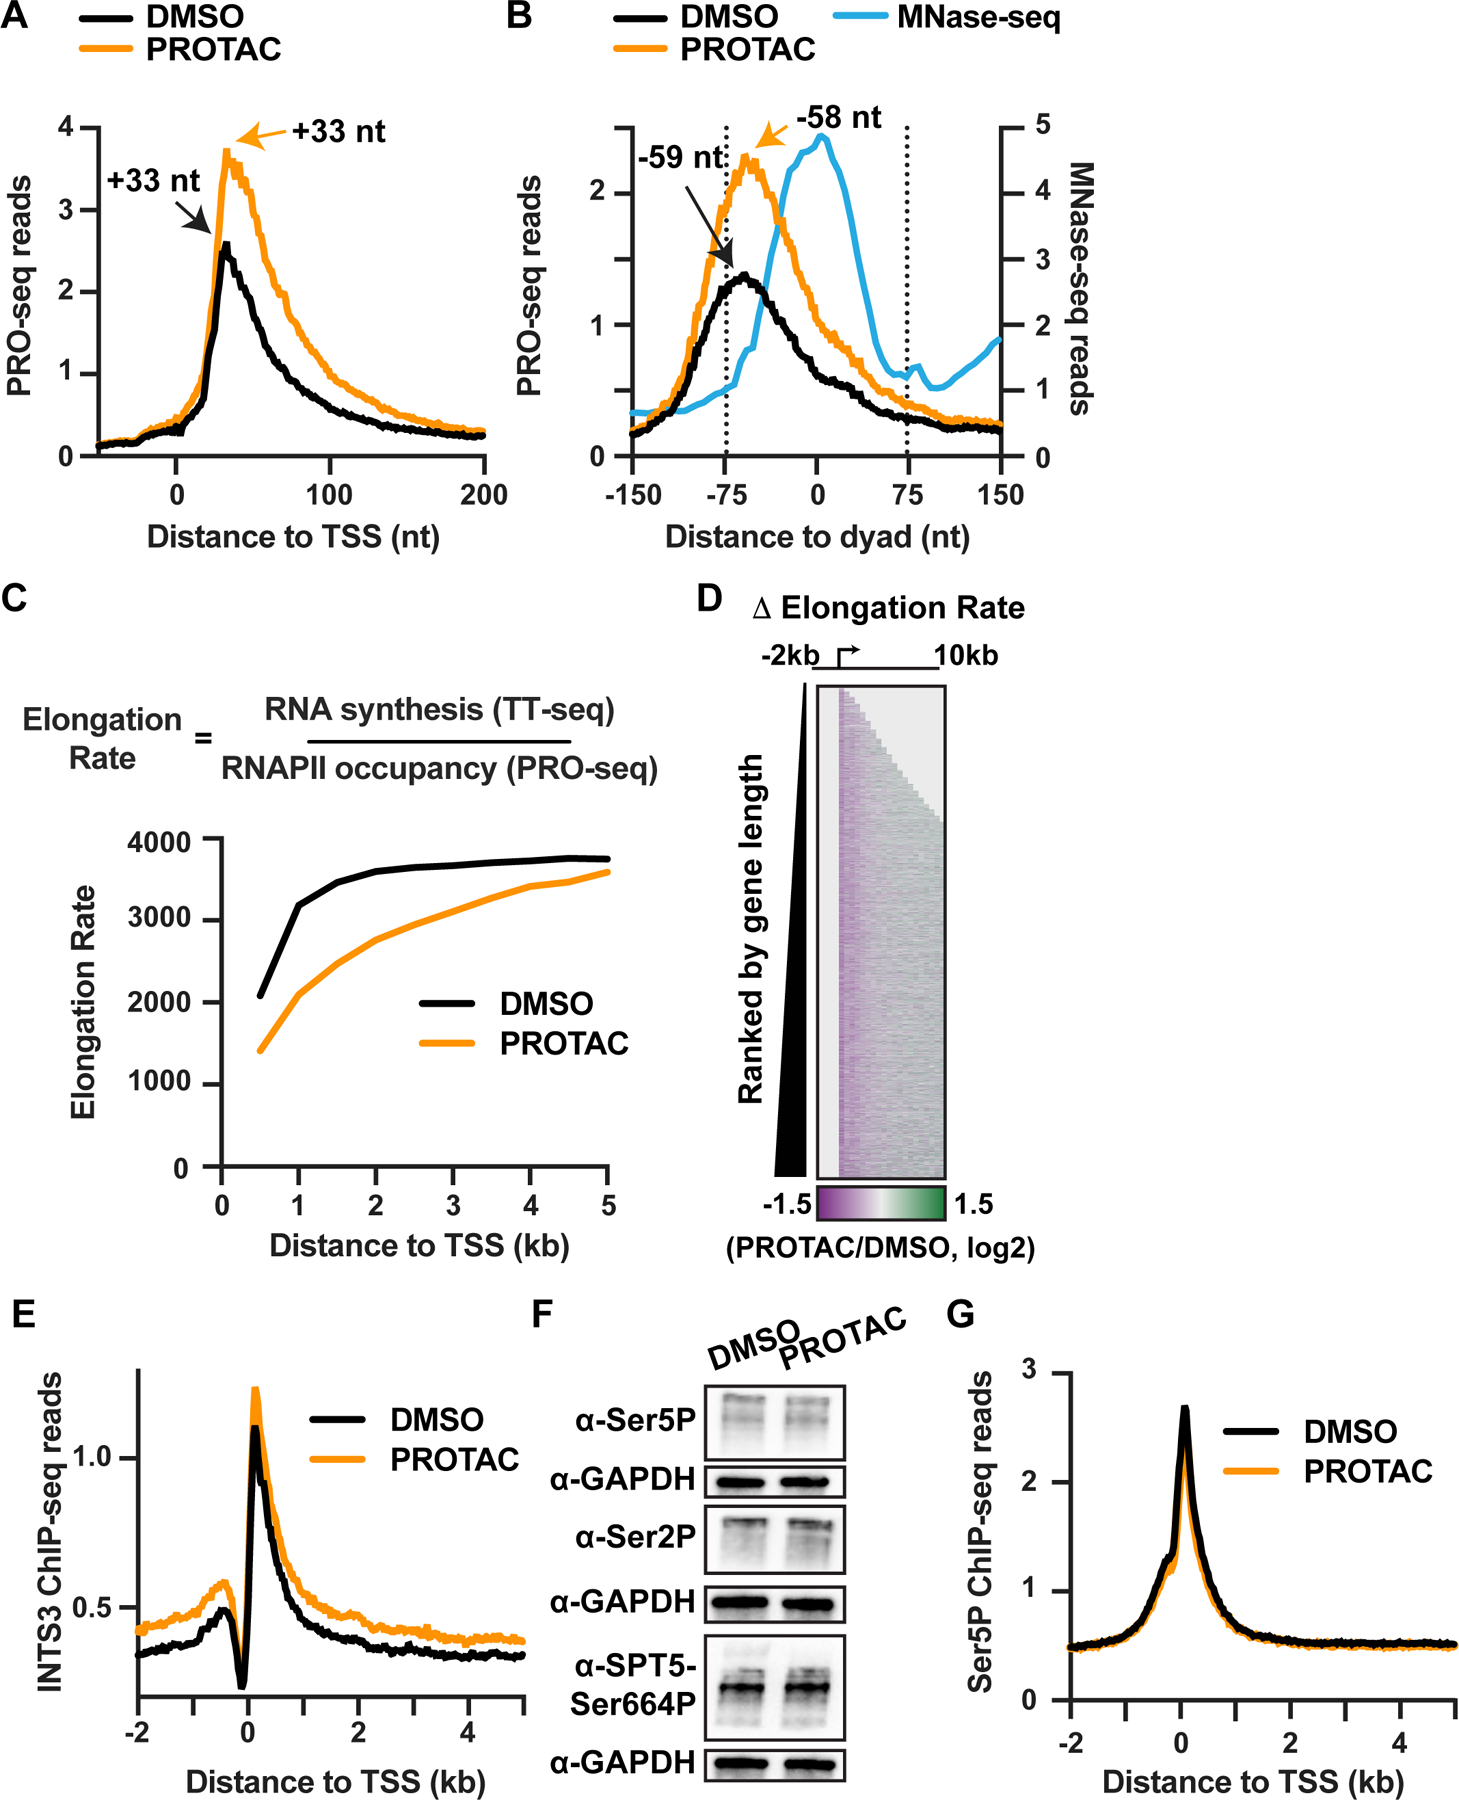
Figure 7. INTS11 depletion reduces elongation rate.

(A and B) Metagene analyses of PRO-seq signal from INTS11Halo cells treated with DMSO or PROTAC for 4 h at mRNA genes with well-defined +1 nucleosomes (N=11,214). Data are shown as average reads per gene aligned around (A) TSSs or (B) the +1 nucleosome dyad, at single nucleotide resolution for PRO-seq and in 5 nt bins for MNase-seq (with reads depicted at read center). The peak location of PRO-seq reads, corresponding to (A) the position of paused RNAPII or (B) the initial position of stalling in the +1 nucleosome, are shown.
(C) Analysis of elongation rate from INTS11Halo cells treated with DMSO or PROTAC for 4 h. Data are shown as average elongation rate in 500 nt bins.
(D) Heatmap representation of fold change in elongation rate after PROTAC treatment for active mRNA genes (N=13,055). TSS is indicated by arrow. Data are shown in 500 nt bins. Bins upstream of the TSS and downstream of the TES are shaded in light gray.
(E) Metagene analysis of average INTS3 ChIP-seq signal around mRNA TSSs (N=13,055), from INTS11Halo cells treated with DMSO or PROTAC for 4 h. Data are shown in 25 nt bins.
(F) Western blots for phosphorylated forms of the RNAPII CTD (Ser5 or Ser2) and SPT5 after 4 h DMSO or PROTAC treatment of INTS11Halo cells. GAPDH is a loading control.
(G) Metagene analysis of Ser5P ChIP-seq signal around mRNA TSSs (N=13,055), from INTS11Halo cells treated as in (F). Data are shown in 25 nt bins.
