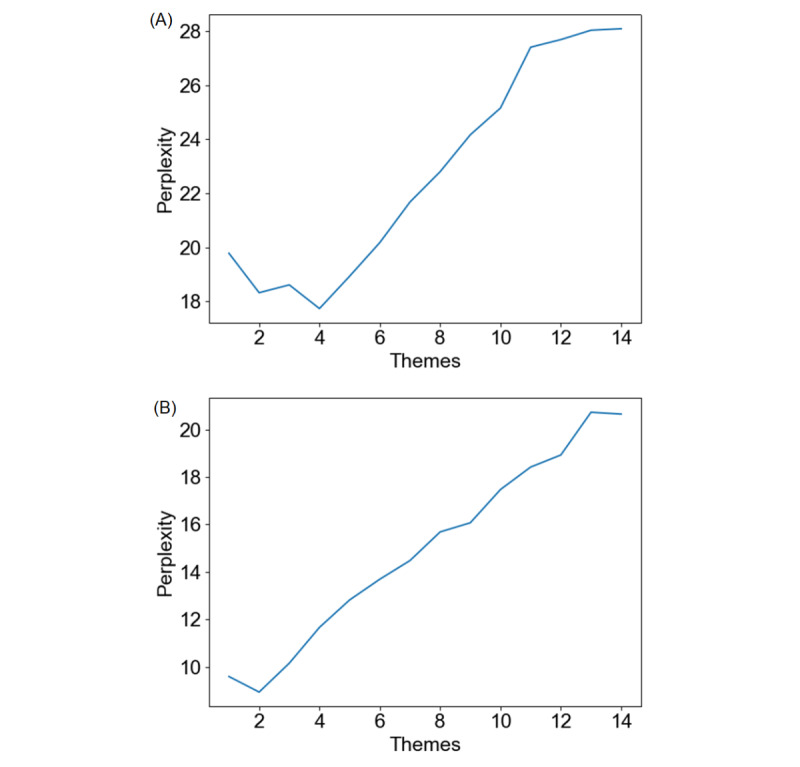
Figure 4.

Chart of themes and perplexity. The image shows the perplexity under different number of themes for participant feedback of the 2 questions, "What was your best experience using XiaoE?" and "What was your worst experience using XiaoE?." (A) Themes-perplexity chart of “best experience.” (B) Themes-perplexity chart of “worst experience”.
