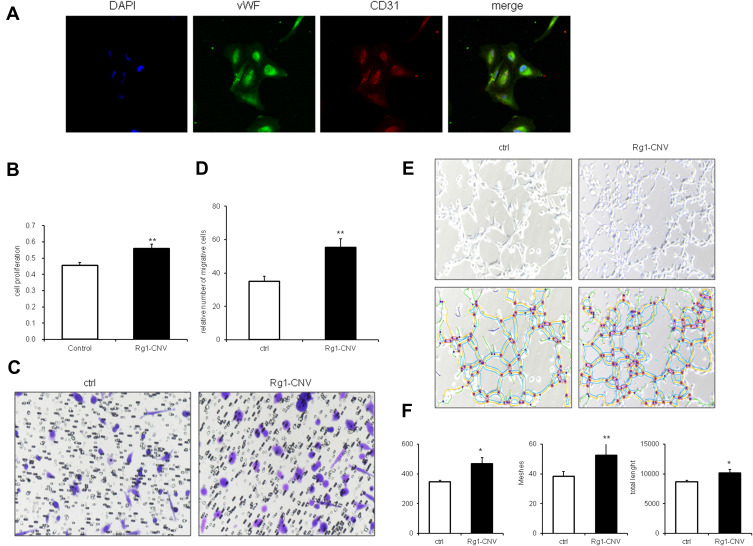
Figure 5.
Effects of ginsenoside Rg1-CNV on proliferation, migration, and tubular formation of BMECs. (A) Identification of rat brain microvascular endothelial cells by immunofluorescence images (400×). (B) Proliferation of BMECs on data statistic. (C) Migration of BMECs in microscope. (D) Migration of BMECs on data statistic. (E) The upper row is tubular formation of BMECs in white-light picture, the lower row is software analysis diagram of tubular formation by Image J v1.8.0. (F) BEMCs tubular formation data statistic. Meshes analyze the number of mesh formed in lumen, Nodes refers to the number of points in lumen, and total length refers to the length of lumen. * P<0.05, ** P<0.01.

