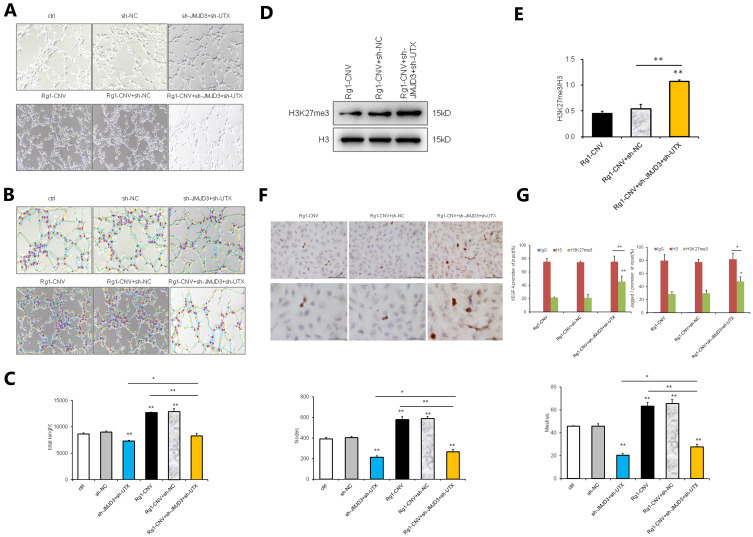
Figure 8.
Rescue experiment (2). (A) Tubular formation of BEMCs in white-light picture. (B) Tubular formation of BEMCs analysis diagram by software ImageJ v1.8.0. (C) Tubular formation of BEMCs analysis on data statistic. Meshes analysis of the number of holes formed in lumen, Nodes is the number of points in lumen, and Total Length is the length of lumen. (D) Western blot analysis of H3K27me3. (E) Protein expression of H3K27me3. (F) Comparison of H3K27me3 expression in each group by Immunohistochemical staining. (G) ChIP detection results of H3K27me3 demethylation in the promoter regions of VEGF-A and Jagged1 genes (IgG was used as the negative control, and H3 was used as the positive control). * P<0.05. ** P<0.01.

