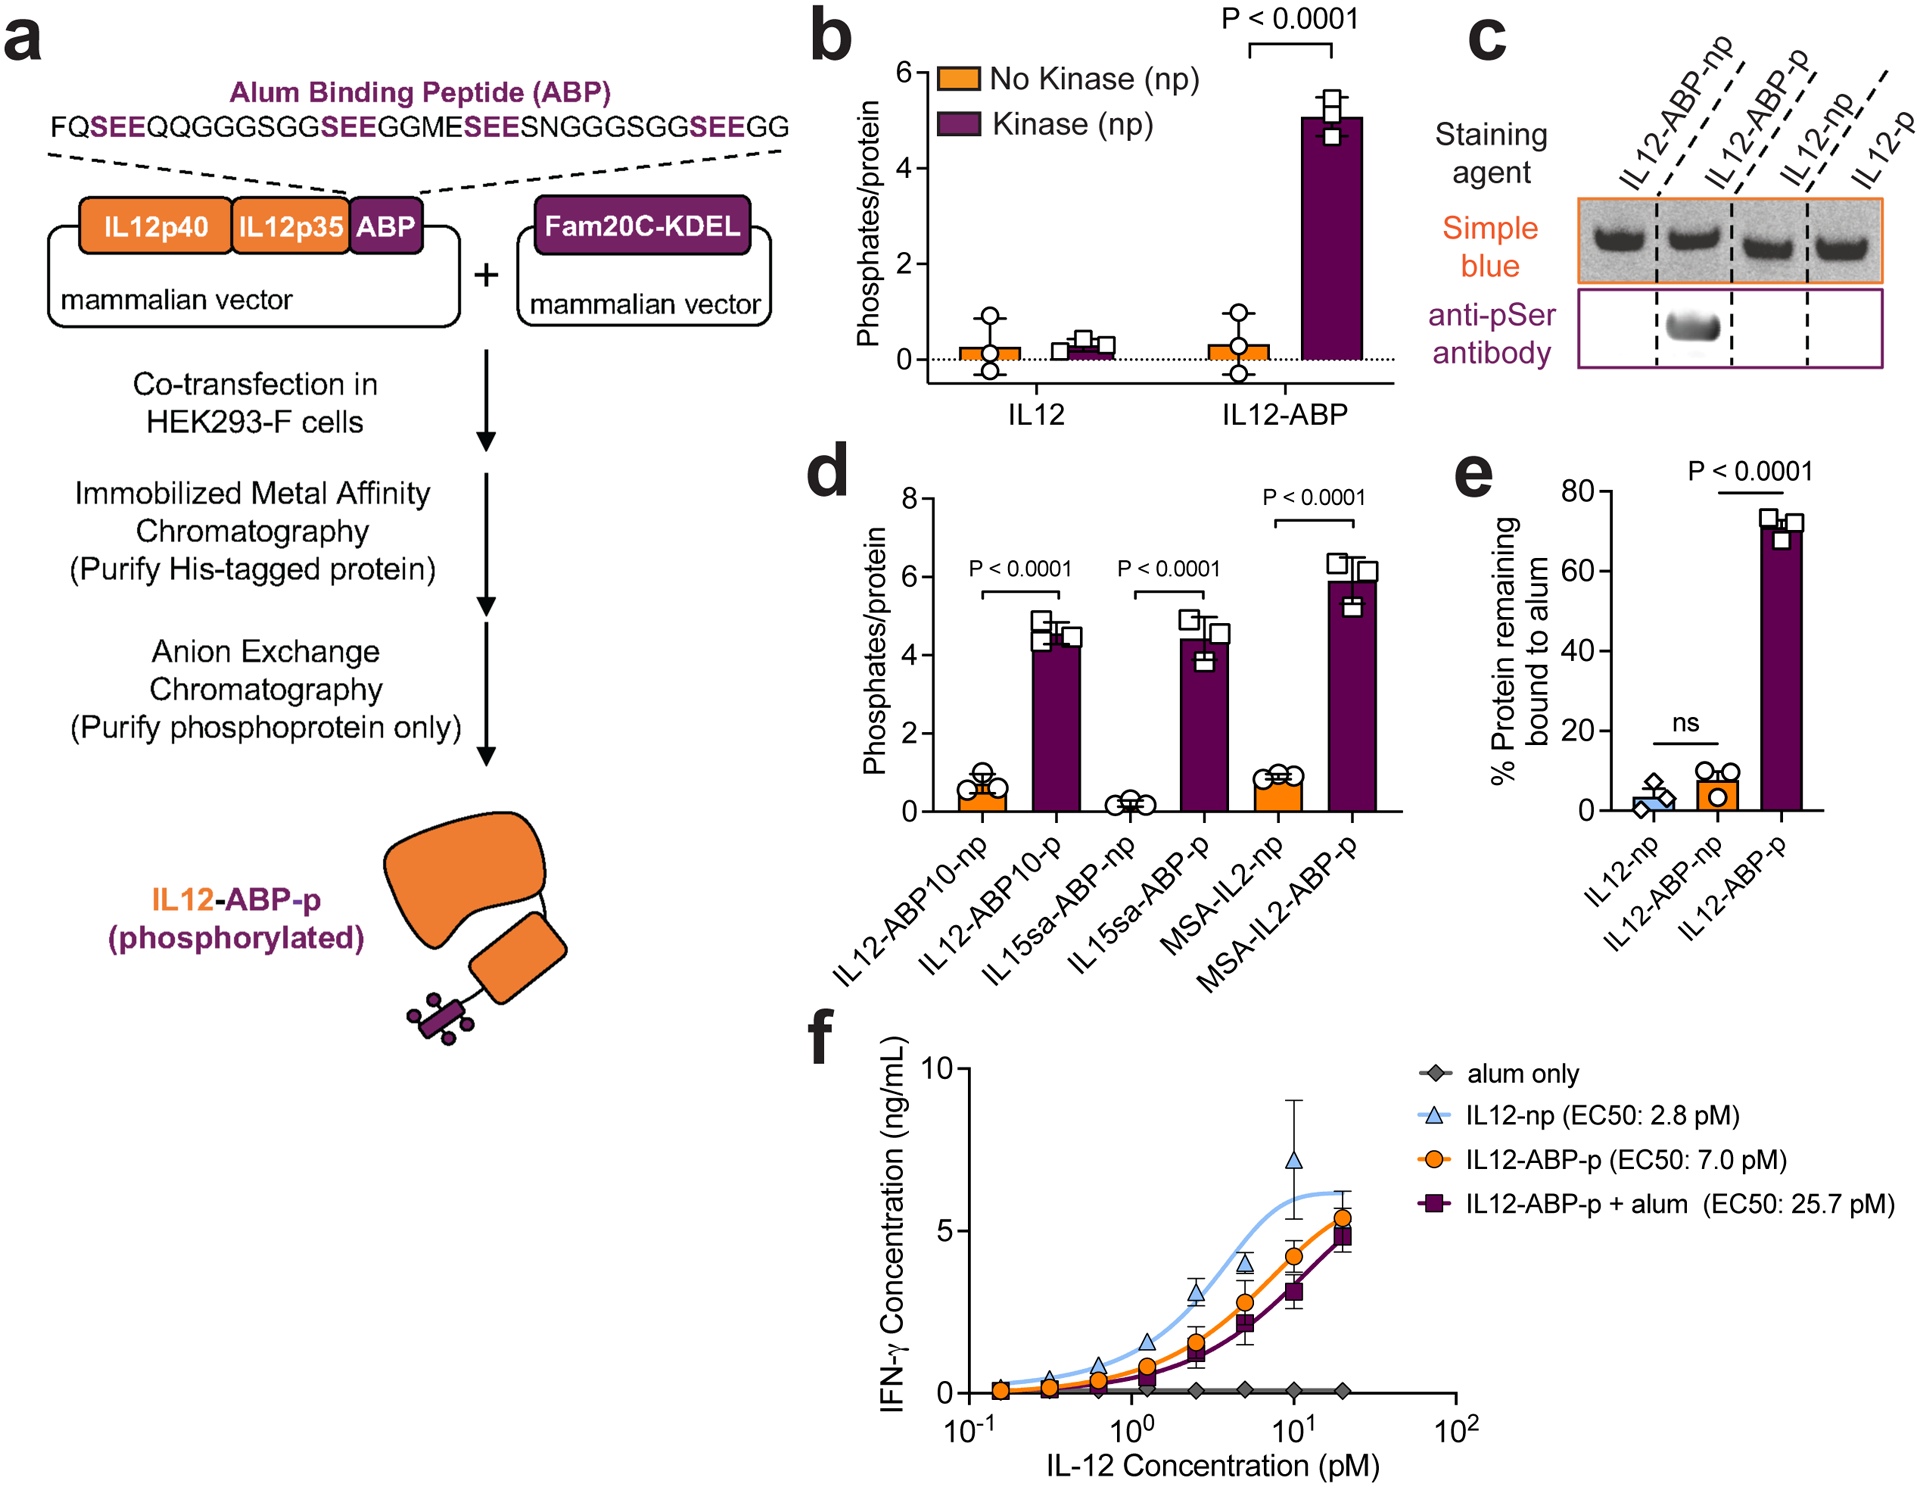
Fig. 1 |. Co-expression of cytokines and Fam20C enables in-cell site-specific serine phosphorylation of interleukins.

a, Manufacturing workflow for ABP-fusion proteins with IL-12 fused to ABP10 as an example. b, Phosphorylation as measured by malachite green assay for IL-12 and IL-12-ABP either expressed alone (np) or co-expressed with Fam20C-KDEL (p). c, Indicated proteins were run on an SDS-PAGE gel stained with Coomassie Blue (Simple Blue, orange) or transferred to a membrane and stained with an anti-pSer antibody followed by an IR800 secondary (purple). Shown are bands for ~65 kDa purified protein. The blot was analyzed by Fiji (ImageJ). The unedited blot image is available as Source Data. d) Phosphorylation was measured as in b for indicated proteins. e) Fluorophore-conjugated IL-12 fusion proteins (10 ug mL−1) were mixed with Alhydrogel (100 ug mL−1) for 30 mins in TBS, then incubated in 10% mouse serum in PBS for 1 h, followed by fluorescence spectroscopy to measure protein remaining bound to alum. f) IL-12 proteins at indicated concentrations (max alum concentration was 6 ng mL−1) were incubated with murine splenocytes for 2 days. Shown are the IFN-γ concentrations measured in culture supernatants by ELISA. ABP refers specifically to ABP10. Data are representative of at least two independent experiments with n=3 technical replicates per group and presented as mean ± SD. P values were determined by ordinary one-way analysis of variance (ANOVA) followed by Tukey’s multiple comparison test (c,e) or two-way ANOVA with Šídák’s multiple comparisons test (b) using GraphPad PRISM and exact P values are indicated (ns, not significant, P > 0.05).
