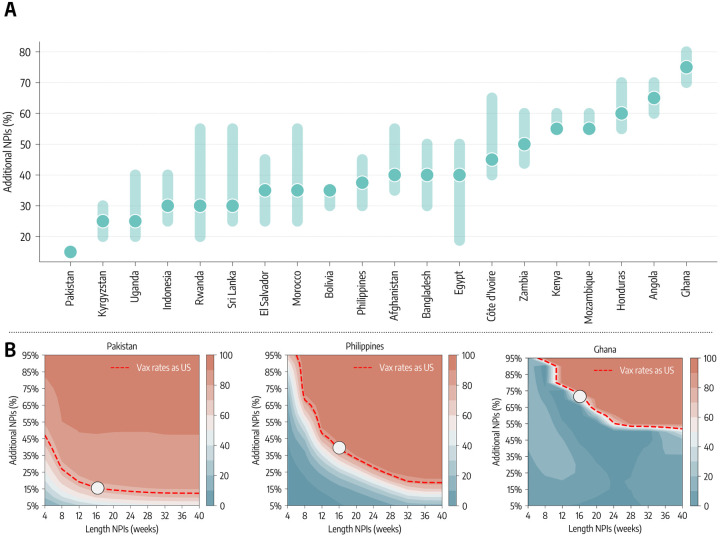
Figure 4: The role of NPIs.
A) Additional NPIs, put in place for four months, needed to match the deaths averted that the vaccination rate of the US would have allowed. B) For three countries we show the contour plots of the percentage of deaths averted (median %) with stricter and/or longer NPIs, relative to the actual vaccination baseline. Percentage of deaths averted achieved by a US-equivalent vaccination rate is plotted as reference (red dashed line).

