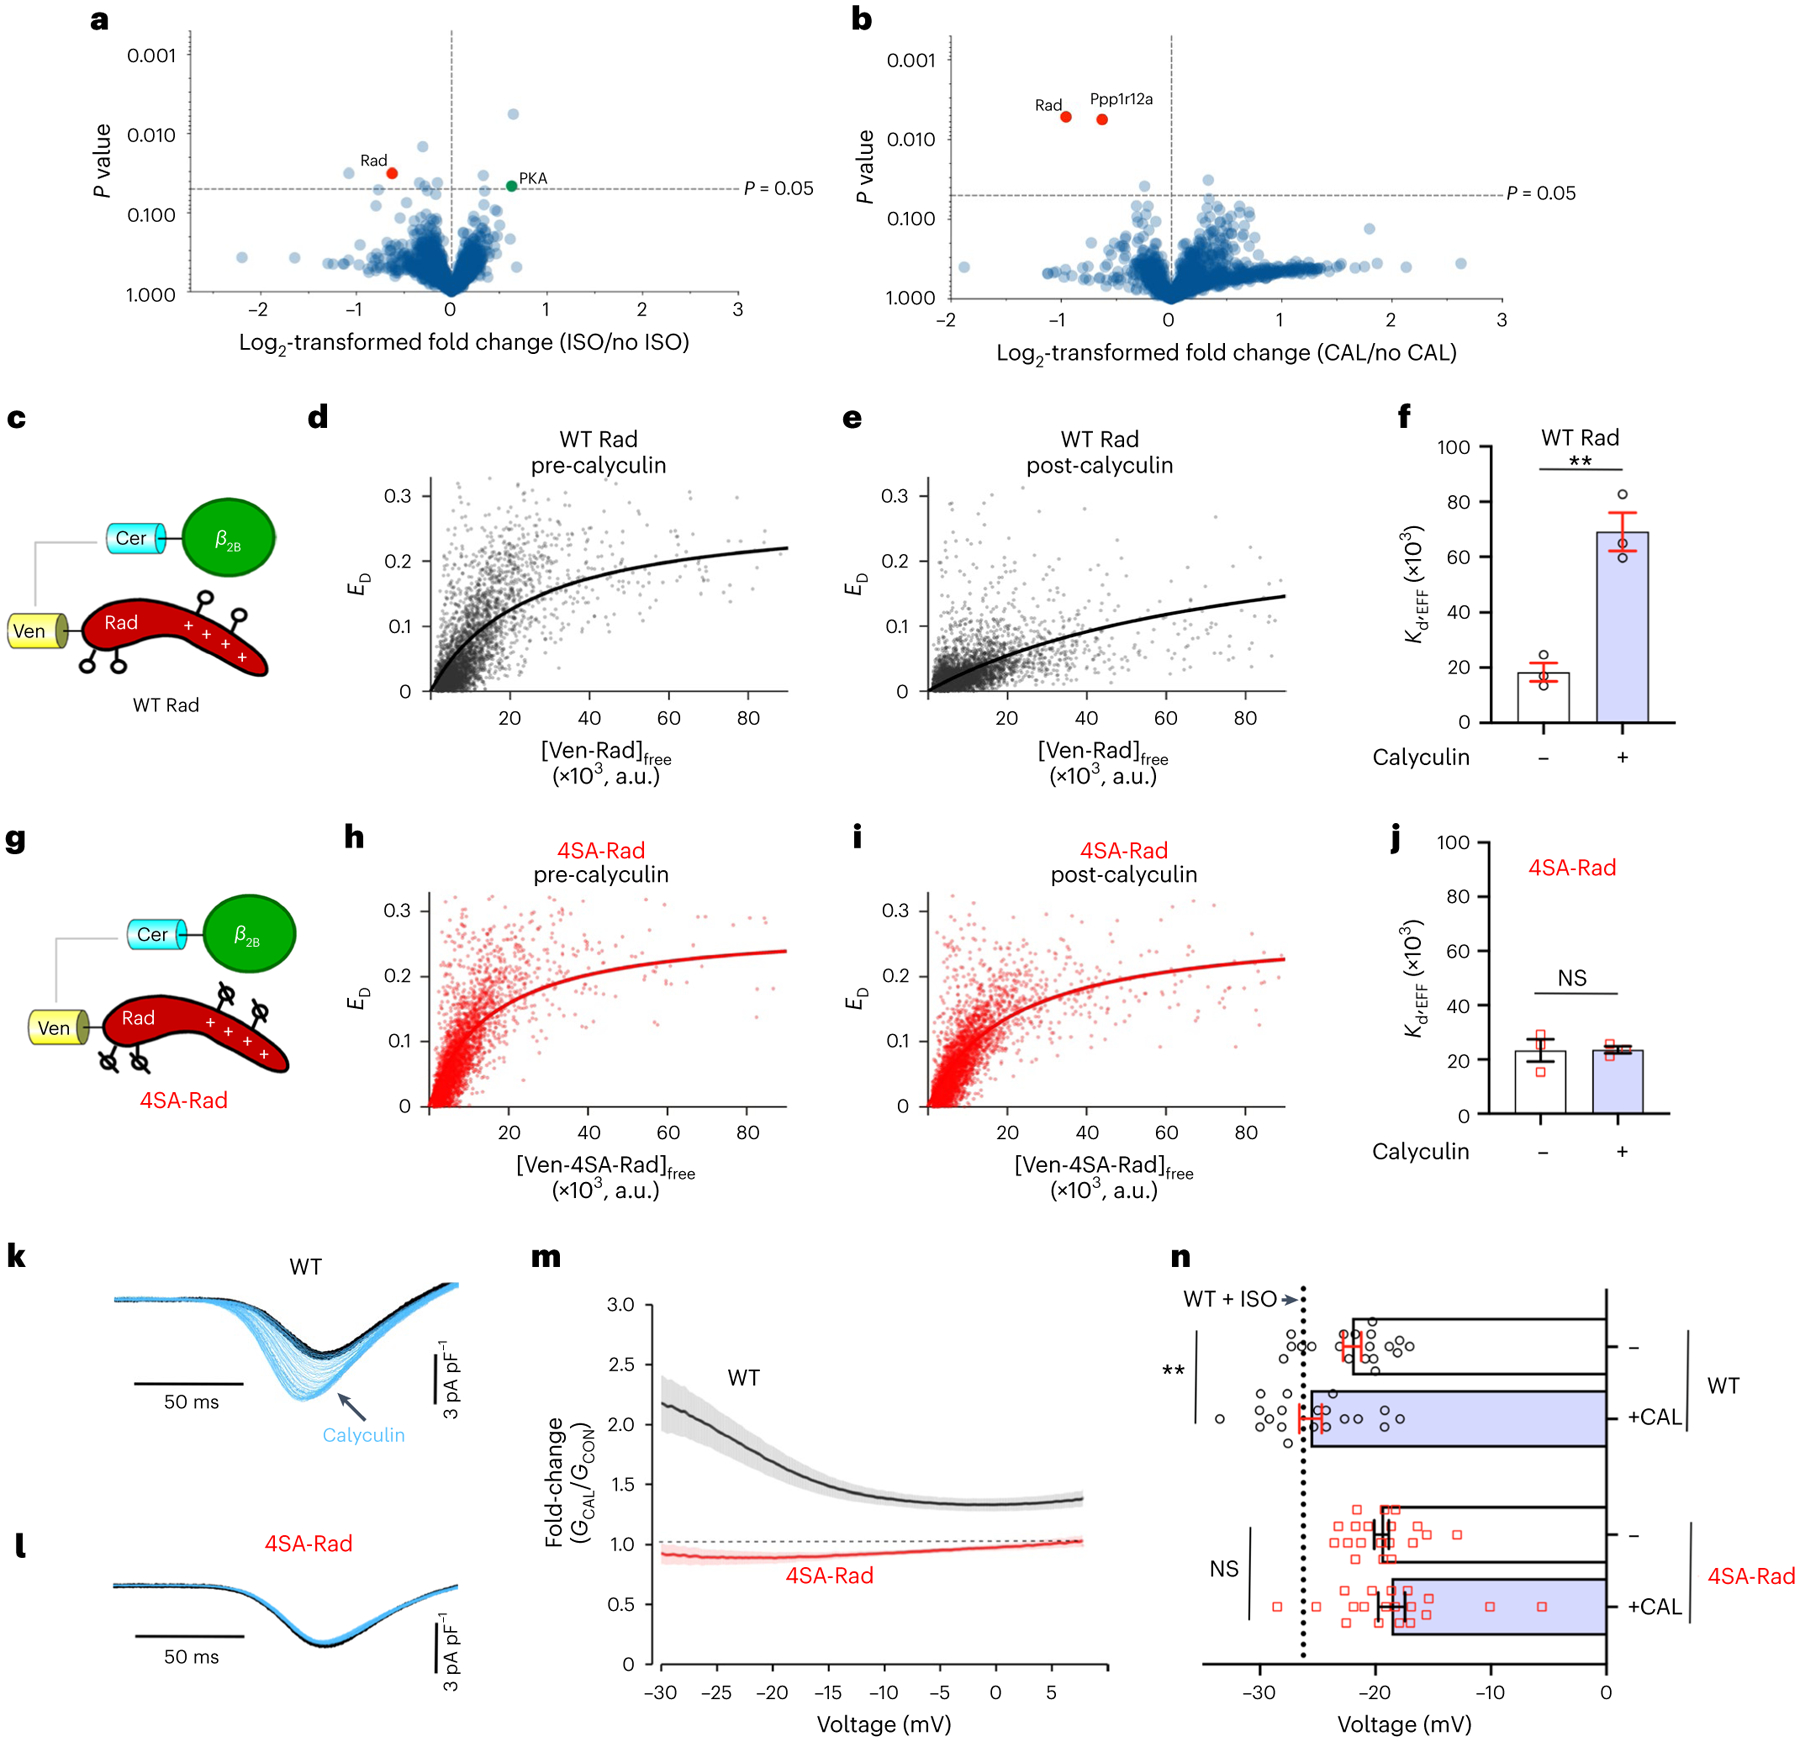
Fig. 2 |. Augmentation of Ca2+ influx by phosphatase inhibitors is Rad dependent.

a,b, Volcano plots of fold-change for relative protein quantification by TMT MS of α1C-APEX2 cardiomyocytes treated with vehicle, isoproterenol or calyculin A (CAL). The data shown are means for five pairs of biologically independent samples. a, Comparison between isoproterenol-treated and vehicle. b, Comparison between calyculin A and vehicle. A nonadjusted, unpaired, two-tailed Student’s t-test was used. PPP1R12A, protein phosphatase 1 regulatory subunit 12A. See Supplementary Table 1 for complete dataset. c,g, Schematics of the FRET pairs, Cer–β2B with Ven–WT-Rad (c) or Ven–4SA-mutant Rad (g) (where Ven is the Venus tag and Cer is the Cerulean tag). d,e, FRET efficiency (ED) is plotted against the free concentration Ven–WT Rad in the absence of (d) and 10 min after (e) exposure to calyculin A. a.u., arbitrary units. Solid line fits a 1:1 binding isotherm. f, Graph summarizing Kd,EFF for the binding of WT Rad and the β2B-subunit. Data are the mean ± s.e.m. (n = 3 for pre- and post-calyculin). **P < 0.01 by unpaired, two-tailed Student’s t-test. h,i, Same as d and e except that Ven–4SA-Rad was used. j, Graph summarizing Kd,EFF for the binding of 4SA-Rad and the β2B-subunit. Data are the mean ± s.e.m. (n = 3 for pre- and post-calyculin; P = 0.96 (NS) by unpaired, two-tailed Student’s t-test). k,l, Ba2+ current elicited by voltage ramp every 6 s, with black traces obtained before and blue traces obtained after calyculin A in WT (k) and 4SA-Rad (l) ventricular myocytes. m, Graph of ratio of Ba2+ conductance after calyculin A treatment to Ba2+ conductance before treatment versus voltage of ventricular cardiomyocytes isolated from WT and 4SA-Rad mice. Data are mean ± s.e.m. (WT: 21 cells, 3 mice; 4SA-Rad: 19 cells, 3 mice). n, V50 before and after calyculin A. Black dashed line in V50 for WT + isoproterenol. Data are the mean ± s.e.m. **P < 0.01 for WT, P = 0.52 for 4SA-Rad by unpaired, two-tailed Student’s t-test. WT: 18 cells, 3 mice; 4SA-Rad: 18 cells, 3 mice.
