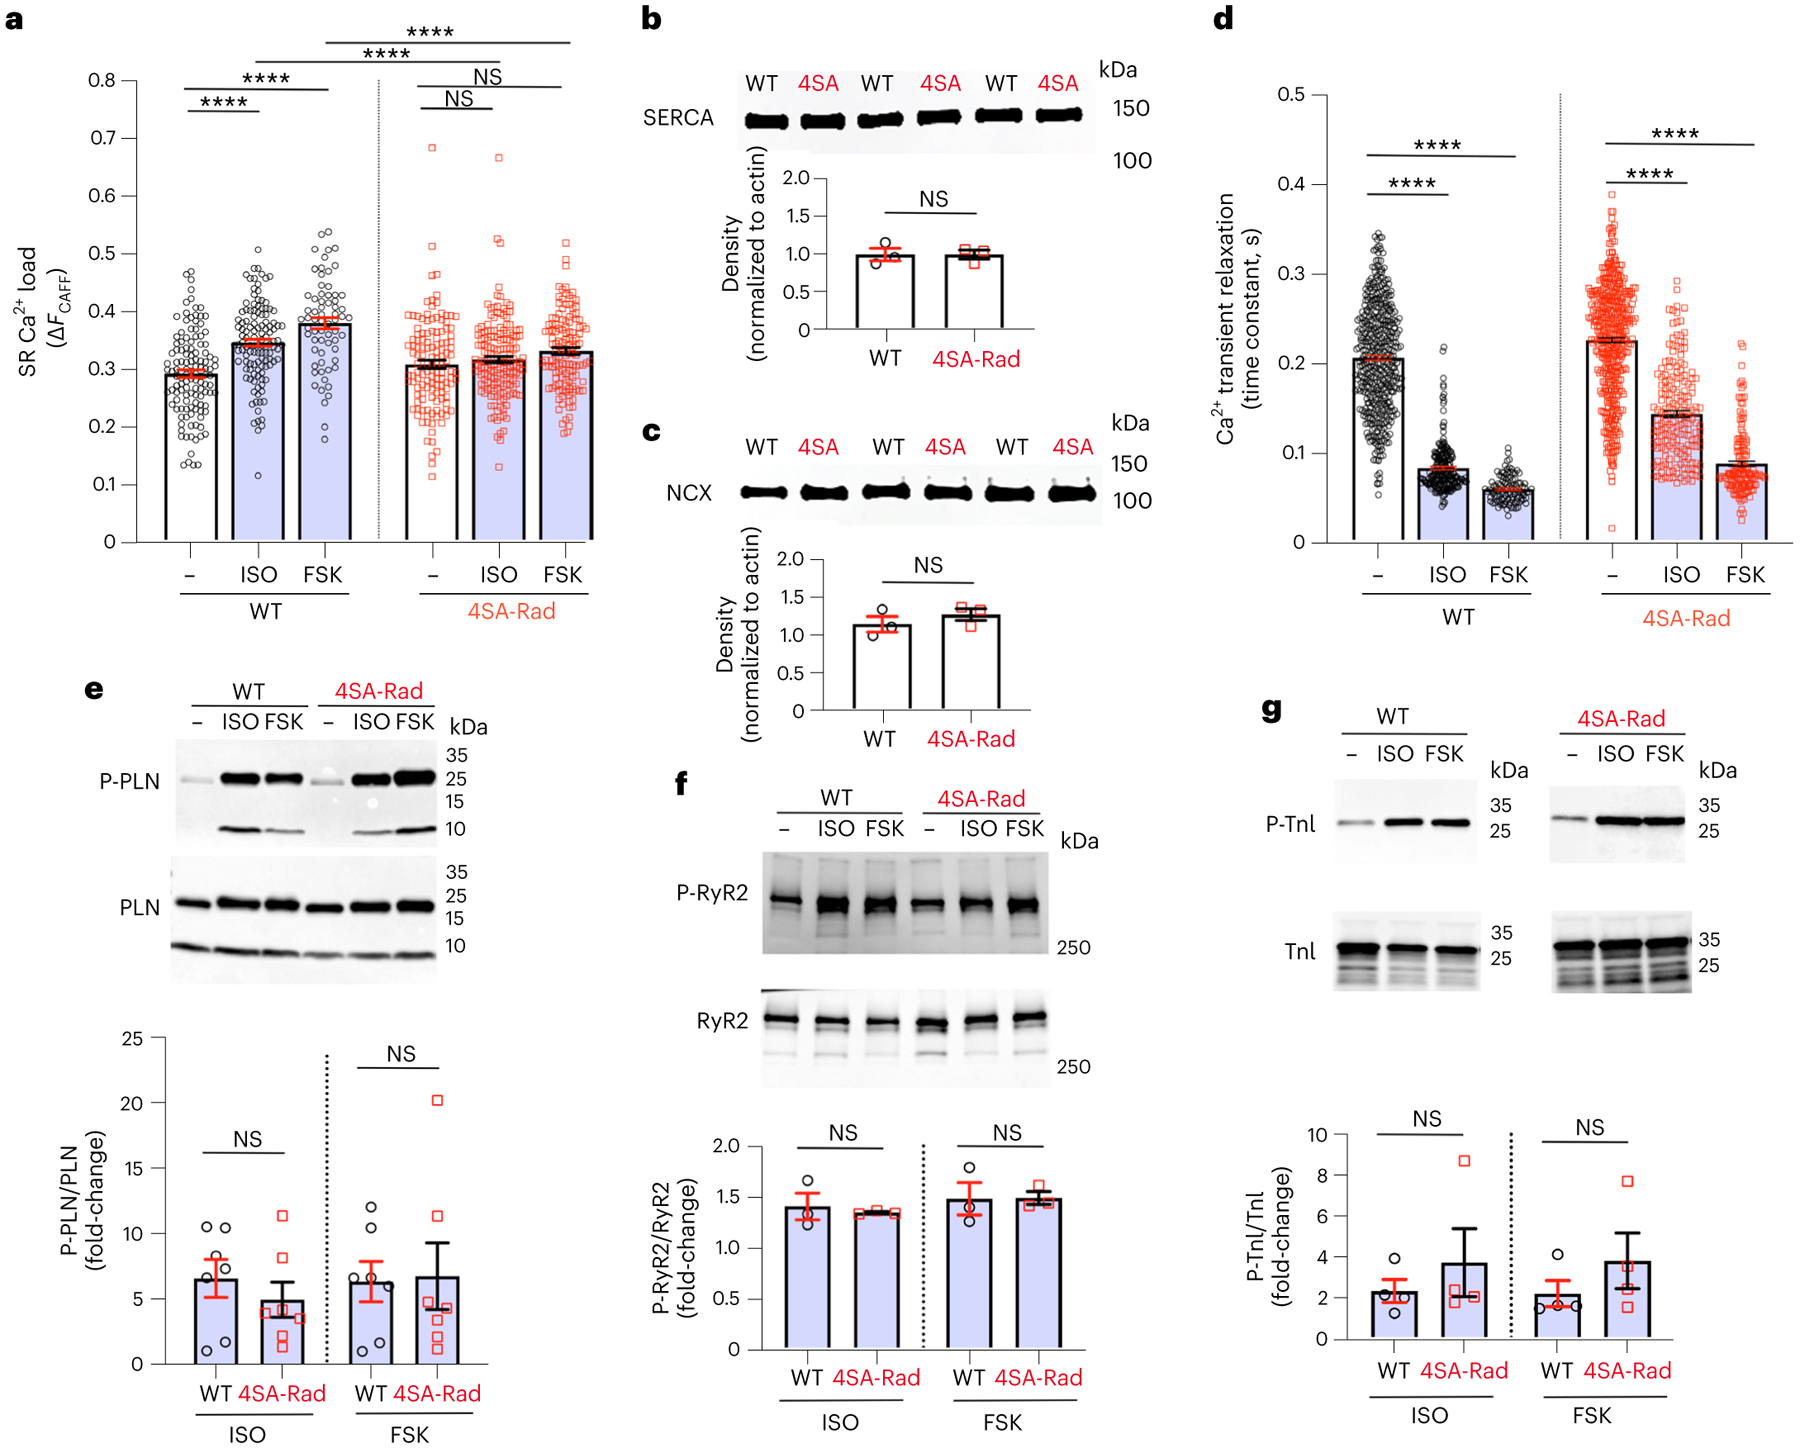
Fig. 4 |. Adrenergic signaling pathways are fully functional in 4SA-Rad mice.

a, Graph of amplitude of Ca2+ transient after caffeine in control, isoproterenoland forskolin-treated cardiomyocytes. Data are the mean ± s.e.m. P < 0.0001 by one-way ANOVA; ****P < 0.0001, **P < 0.01 by Sidak’s multiple-comparison test (n = 121, 120, 66, 129, 165 and 129 cardiomyocytes from 3, 4, 5, 3, 4 and 5 mice, respectively). b, Anti-SR Ca2+-ATPase (SERCA) antibody western blot of protein lysates of cardiomyocytes isolated from WT and 4SA-Rad mice. Lower: graph of density normalized to β-actin. Data are the mean ± s.e.m. Unpaired, two-tailed Student’s t-test. P > 0.99 (n = 3 mice in each group). c, Same as b except with anti-NCX antibody western blot. Lower: graph of density normalized to β-actin. Data are the mean ± s.e.m. Unpaired, two-tailed Student’s t-test P = 0.38 (n = 3 mice in each group). d, Graph of time constant of Ca2+ transient relaxation under basal conditions and after either isoproterenol or forskolin. Data are the mean ± s.e.m. P < 0.0001 by one-way ANOVA, ****P < 0.0001 by Tukey’s multiple-comparison test (n = 462, 225, 109, 478, 183, 149 cardiomyocytes from 12, 4, 3, 13, 5 and 5 mice, respectively, from left to right). e, Anti-phospho-PLN (P-PLN) antibody (upper) and anti-PLN antibody (middle) western blots of protein lysates of cardiomyocytes. Lower: graph of P-PLN density normalized to PLN density. Data are the mean ± s.e.m. P = 0.43 and P = 0.89, from left to right, by unpaired, two-tailed Student’s t-test (n = 7 mice in each group). f, Same as in e except with anti-phospho-S2808 RyR2 antibody (upper) and anti-RyR2 antibody (middle) western blots. Lower: graph of P-RyR2 density normalized to RyR2 density. Data are the mean ± s.e.m. P = 0.66 and P = 0.97, from left to right, by unpaired, two-tailed Student’s t-test (n = 3 mice in each group). g, Same as in e except with anti-S23/S24 TnI antibody (upper) and anti-TnI antibody (middle) western blots. Lower: graph of P-TnI density normalized to TnI density. Data are mean ± s.e.m. P = 0.46 and P = 0.33, from left to right, by unpaired, two-tailed Student’s t-test (n = 4 mice in each group).
