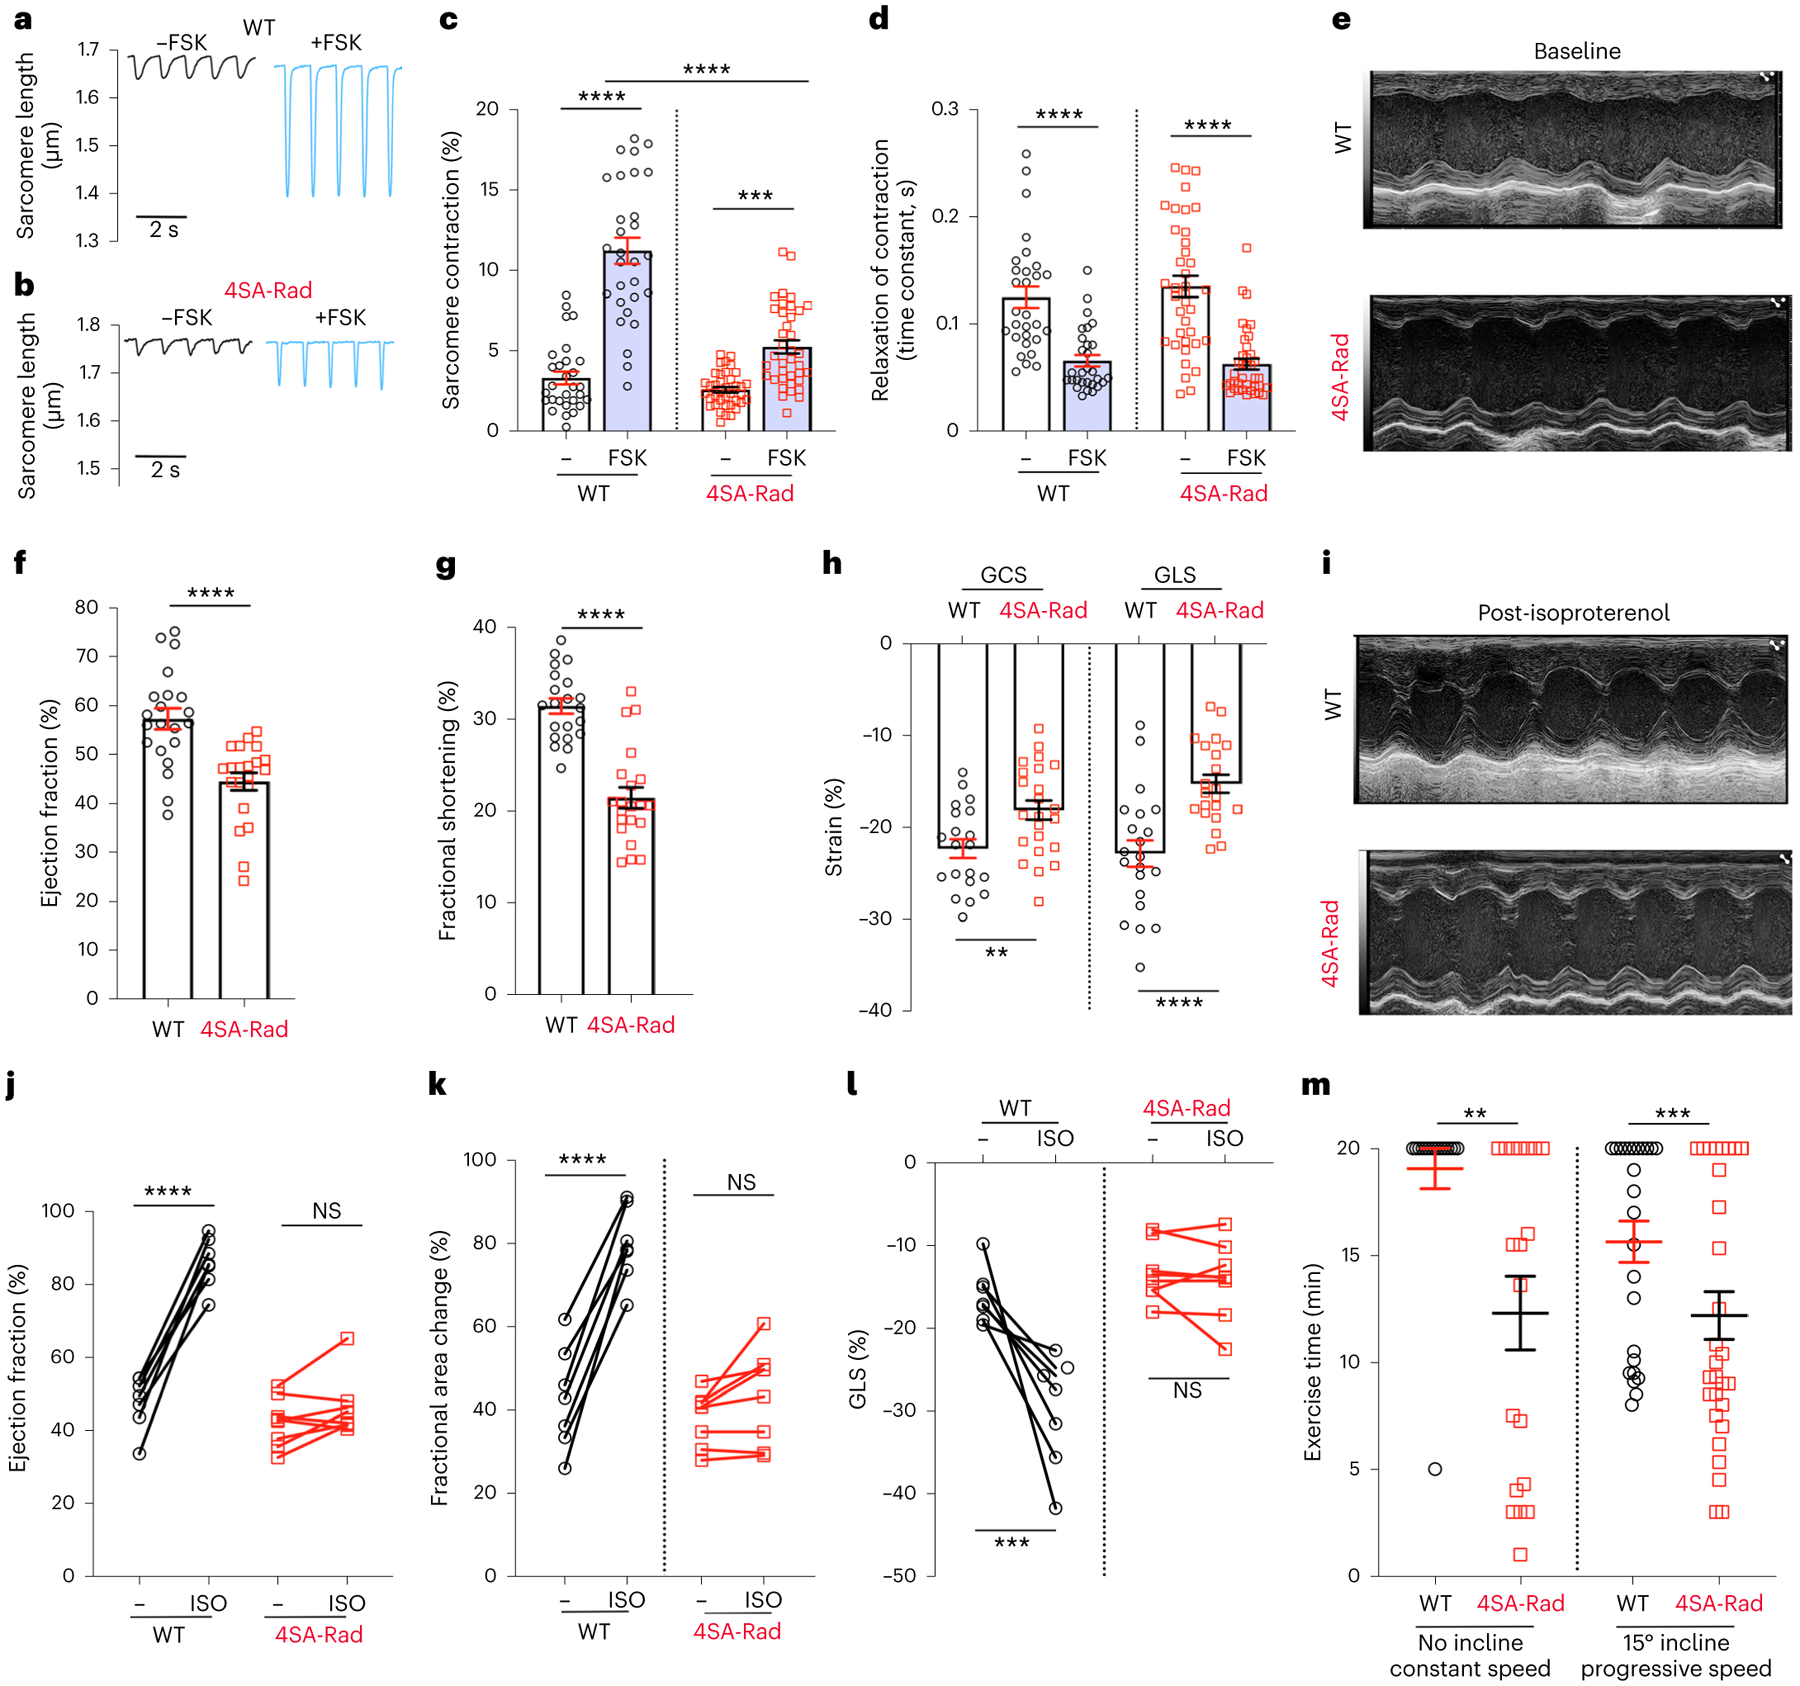
Fig. 5 |. Phosphorylation of Rad required for regulation of contractility.

a,b, Pacing-induced change in sarcomere length before and after superfusion of forskolin. c, Graph showing field-stimulation-induced percentage change in sarcomere length. Data are the mean ± s.e.m. P < 0.0001 by one-way ANOVA; ***P < 0.001, ****P < 0.0001 by Sidak’s multiple-comparison test (n = 29, 29, 38 and 38 cardiomyocytes from 9, 9, 8 and 8 mice, respectively, from left to right). d, Graph of single-exponential decay time constant of reduction in contraction. Data are the mean ± s.e.m. ****P < 0.0001 by unpaired, two-tailed Student’s t-test (n = 29, 29, 38 and 38 cardiomyocytes from 9, 9, 8 and 8 mice, respectively, from left to right). e,i, Representative M-mode echocardiographic recordings before (e) and after (i) intraperitoneal injection of isoproterenol (ISO). f,g, Graphs of ejection fraction and fractional shortening from echocardiograms. Data are the mean ± s.e.m. ****P < 0.0001 by unpaired, two-tailed Student’s t-test (n = 21 mice for each group). h, Graphs of GCS and GLS. Data are the mean ± s.e.m. **P < 0.01, ****P < 0.0001 by unpaired, two-tailed Student’s t-test (n = 20, 23, 20 and 21 mice, from left to right). j, Graph of ejection fraction before and after isoproterenol. Data are the mean ± s.e.m. ****P < 0.0001 and P = 0.29 by unpaired, two-tailed Student’s t-test (n = 7 and 8 mice, from left to right). k, Graph of fractional area of change before and after isoproterenol. Data are the mean ± s.e.m. ****P < 0.0001 and P = 0.27 by unpaired, two-tailed Student’s t-test (n = 7 and 8 mice, from left to right). l, Graph of GLS before and after isoproterenol. ***P < 0.001 and P = 0.69 by unpaired, two-tailed Student’s t-test (n = 7 and 8 mice, from left to right). m, Graph of exercise time for WT and 4SA-Rad mice using either no incline or 15° incline with progressively increasing speed. Data are mean ± s.e.m. *P < 0.05, ***P < 0.001 by Mann–Whitney U-test (n = 16 mice (7 male/9 female), 19 mice (10 male/9 female), 25 mice (12 male/13 female) and 29 mice (15 male/14 female), from left to right).
