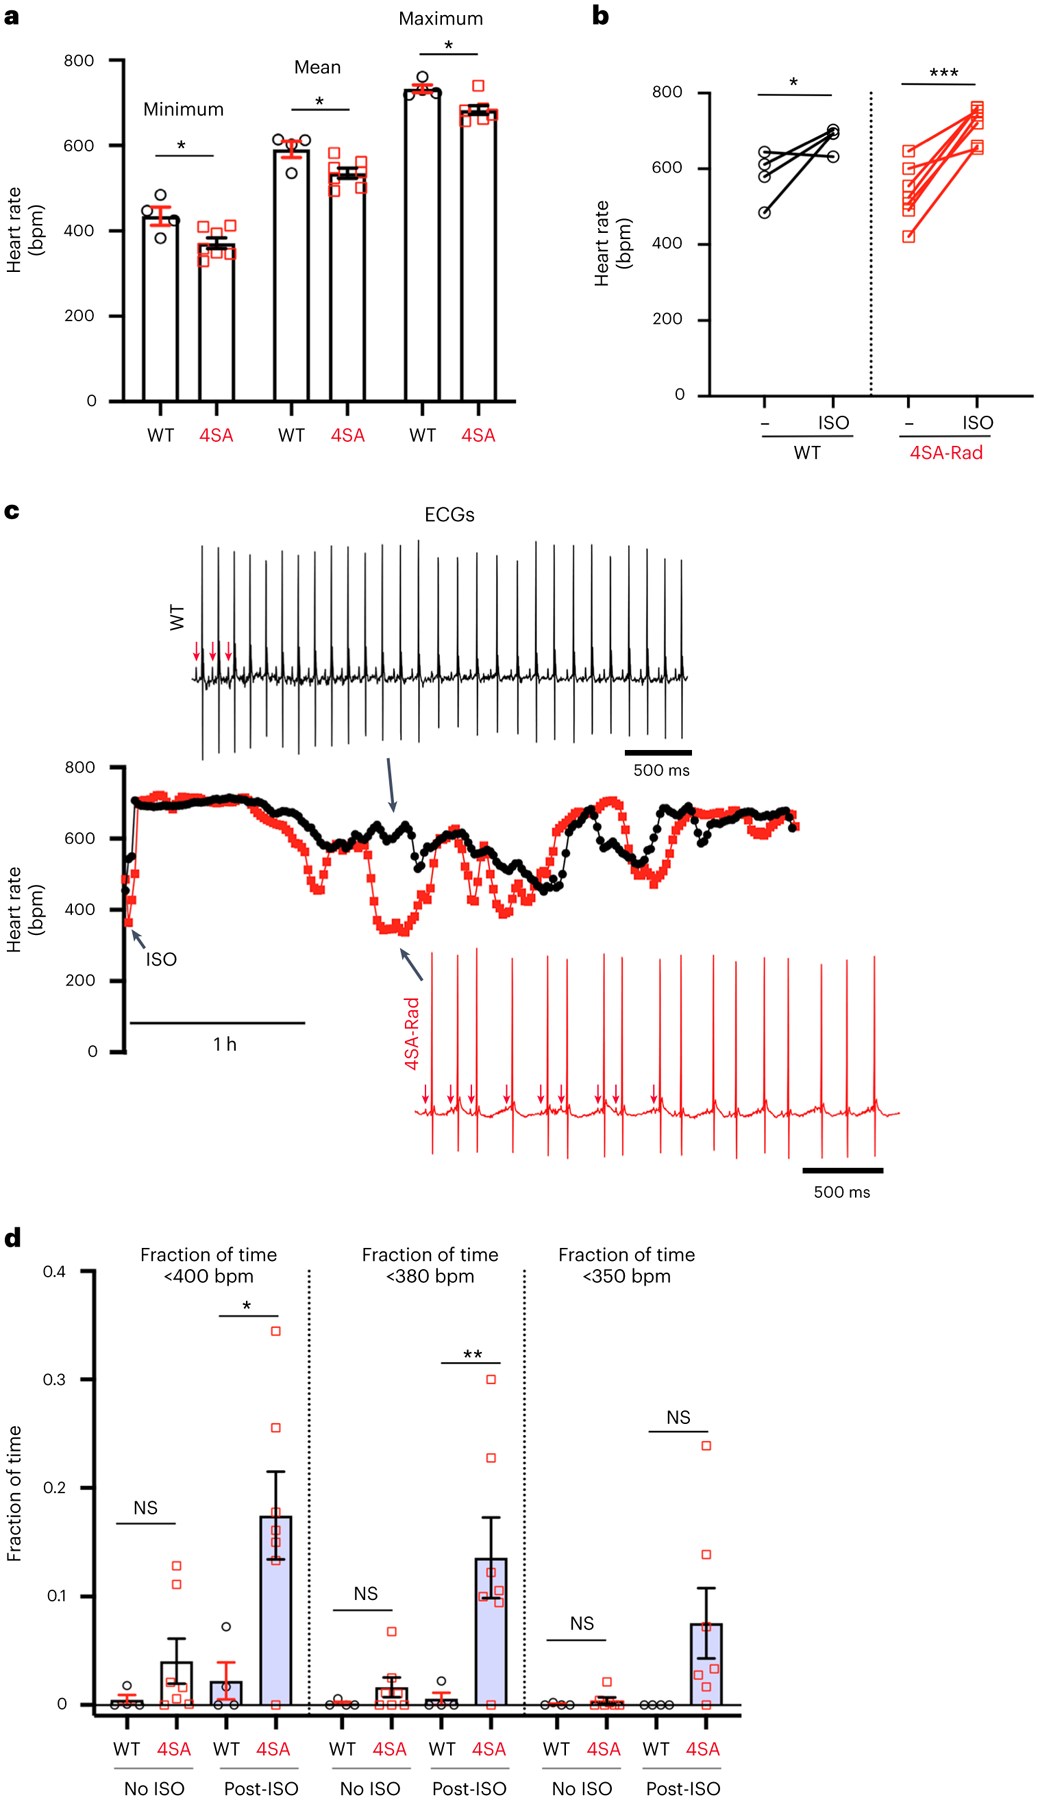
Fig. 6 |. Phosphorylation of Rad required for regulation of heart rate in vivo.

a, Graph of minimum, mean and maximum heart rate over a 24-h period. Data are the mean ± s.e.m. *P < 0.05 by unpaired, two-tailed Student’s t-test (n = 4 WT mice; 7 4SA-Rad mice). b, Graph of heart rate before and 10 min after intraperitoneal injection of isoproterenol. Data are the mean ± s.e.m. *P < 0.05, ***P < 0.001 by unpaired, two-tailed Student’s t-test. c, Representative diary plots of heart rate during 4-h period after intraperitoneal injection of isoproterenol. The black trace is a WT mouse and the red trace a 4SA-Rad mouse. Representative ECGs are shown for the indicated timepoint. The arrows point to atrial activations (P waves). d, Graph of fraction of time in which heart rates were <400 beats min−1 (bpm), 380 bpm or 350 bpm during a 24-h period without isoproterenol and a 3-h period post-isoproterenol injection. Data are the mean ± s.e.m. *P < 0.05, **P < 0.01 by unpaired, two-tailed Student’s t-test. Specific P values can be found in the associated Source data (see Supplementary Information) (n = 4 WT and 7 4SA-Rad mice).
