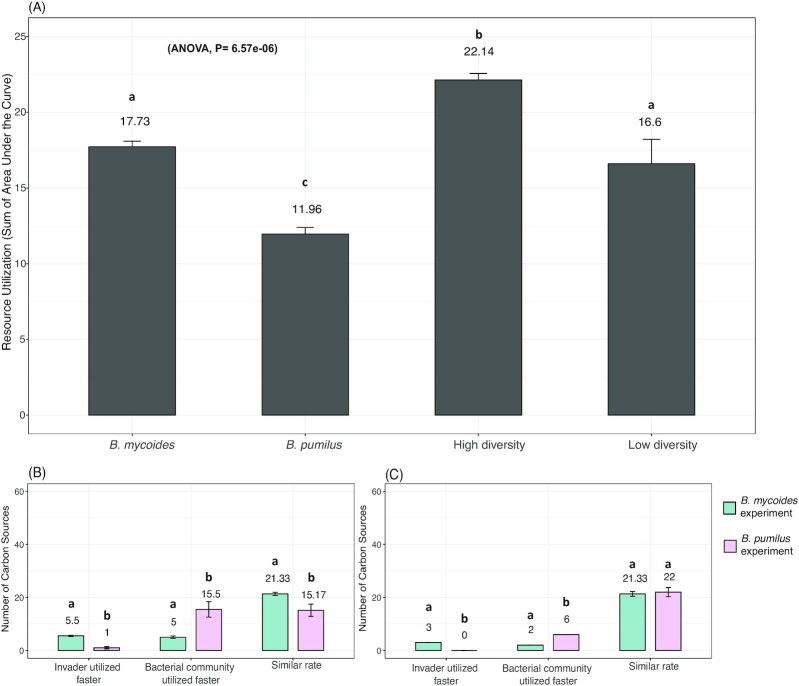
Figure 3.
Total resource use of each bacterial invader and the soil resident community before the invasion (A). The number of carbon sources used faster by the bacterial inoculants, faster by the soil community, or similarly by the inoculant and the resident community, distinguishing the B. mycoides experiment (blue) and the B. pumilus experiment (pink), in high (B) and low diversity (C)treatments. Bars represent the standard error of the mean. Different letters above the bars indicate significant differences within each panel.

