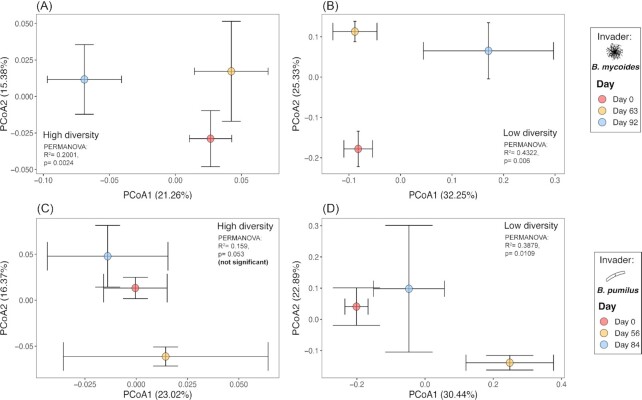
Figure 5.
Temporal variation of the soil community niche structure, depicted by PCoA plot of Bray–Curtis dissimilarity, for the B. mycoides(A and B) and B. pumilus(C and D)invasion experiments, for the high (A, C) and low diversity (B, D) treatments. For each panel, the effect of invasion on the community niche structure, determined by PERMANOVA, indicated with the R2 and p values when significant. Each point corresponds to the centroid computed from the replicates and is presented with the standard errors (error bars) for the first two PCoA axes.

