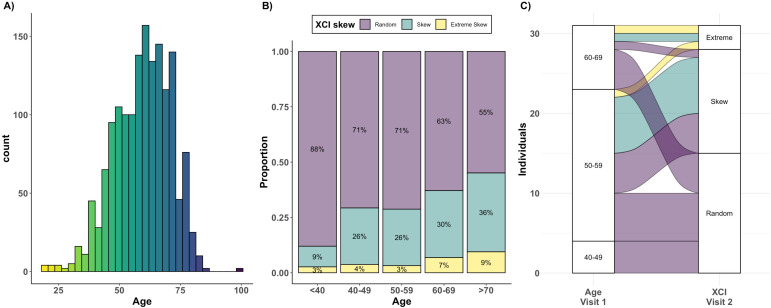
Figure 2. Age acquired XCI-skew across age groups and time.
(A) A histogram displaying the age distribution of the TwinsUK HUMARA cohort (age range: 19–99; median age = 61). (B) The proportions of individuals (y-axis) in each of three XCI-skew categories across increasing age groups (x-axis) are shown (N=1575). (C) A Sankey plot shows the longitudinal changes to XCI in 31 individuals across two measures 15–17 years apart. Colours indicate XCI at visit 1, axis 1 displays the age group of individuals at visit 1, and axis 2 displays XCI at visit 2.

