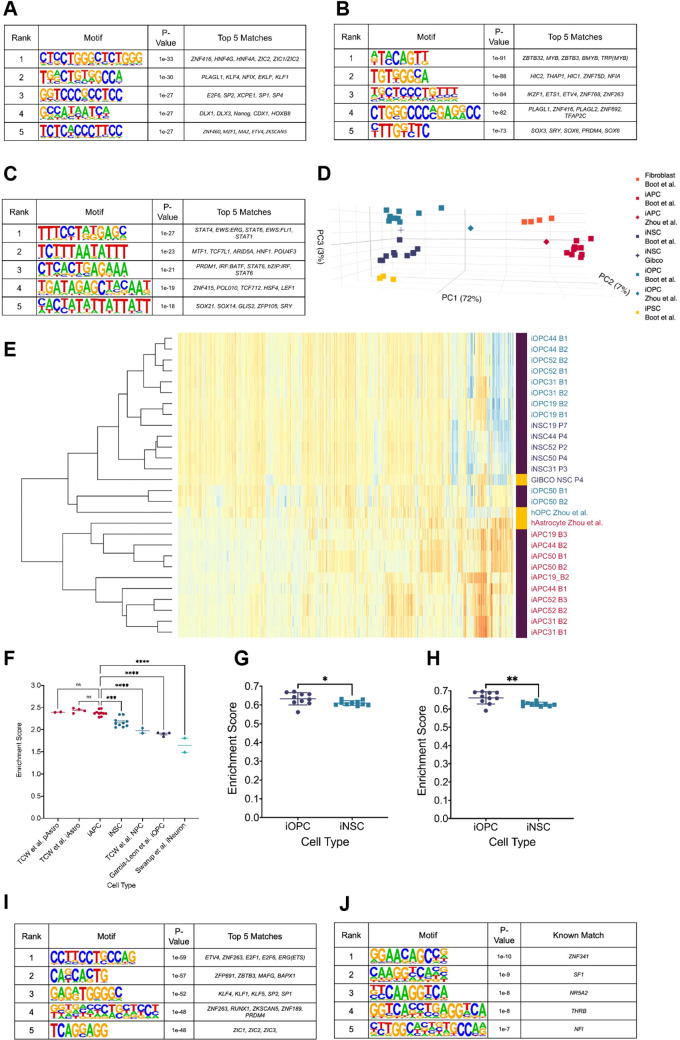
Figure 2. Hypo-methylated differentially methylated regions (DMRs) from bias-glioblastoma initiating cells (B-GICs) are enriched for transcription factor binding sites linked to glial differentiation.
(A) Top five motifs enriched in all hypo-methylated DMRs from B-GICs as compared to all other DMRs from all GICs. (B) Top five motifs enriched in all hypo-methylated DMRs from B-GICs as compared to all the hypo-methylated DMRs from all other GICs. (C) Top five motifs enriched in all hyper-methylated DMRs from B-GICs as compared to all other DMRs from all GICs. (D) 3D principal component analysis (PCA) of methylation data from patient-derived fibroblasts, induced pluripotent stem cells (iPSCs), induced neural stem cells (iNSCs), induced astrocyte progenitor cells (iAPCs), induced oligodendrocyte progenitor cells (iOPCs), and publicly available reference datasets of NSCs, astrocytes, and oligodendrocyte precursor cells. (E) Unsupervised hierarchical clustering based on the top 5000 variable methylation probes of iAPCs, iNSCs, iOPCs (purple bar), and publicly available reference datasets (yellow bar). (F) Single sample gene set enrichment analysis (ssGSEA) enrichment scores for the astrocyte composite signature (ACS) of iAPCs (N=10), iNSCs (N=10), and publicly available reference datasets, statistical differences tested with one-way ANOVA. ssGSEA enrichment scores of iOPCs (N=10) and iNSCs (N=10) for the Oligodendrocyte Specific-300 (G) and Oligodendrocyte Enriched-300 (H) gene signatures, statistical significance tested using Mann-Whitney t-test. Top five de novo (I) and known (J) motifs enriched in all hypo-methylated DMRs in iAPCs, from each iAPC versus iNSC comparison.


