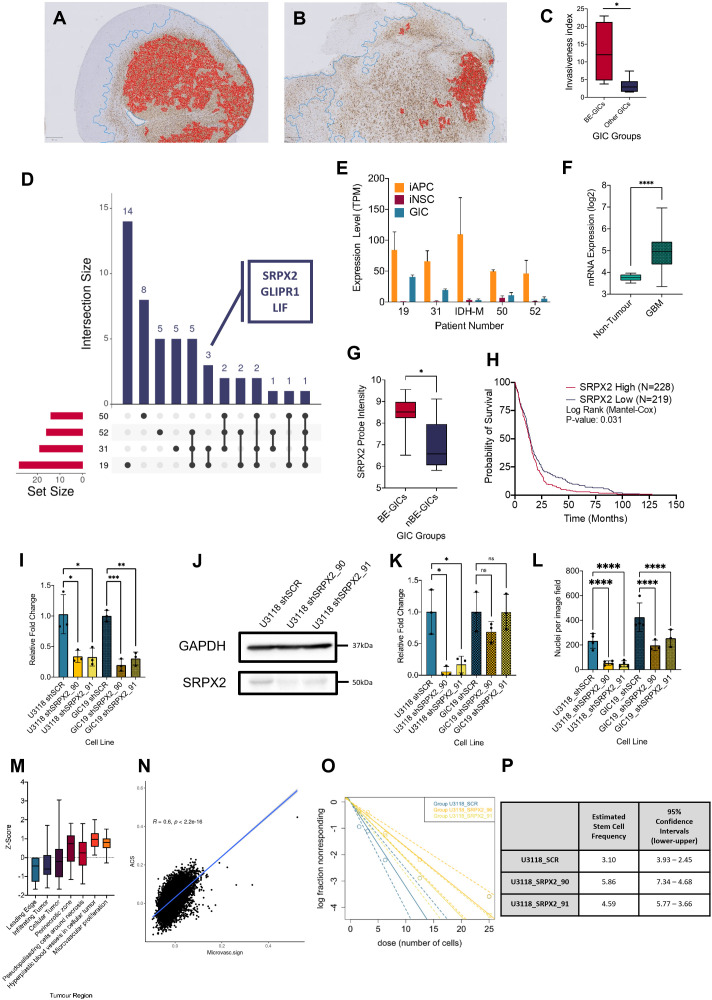
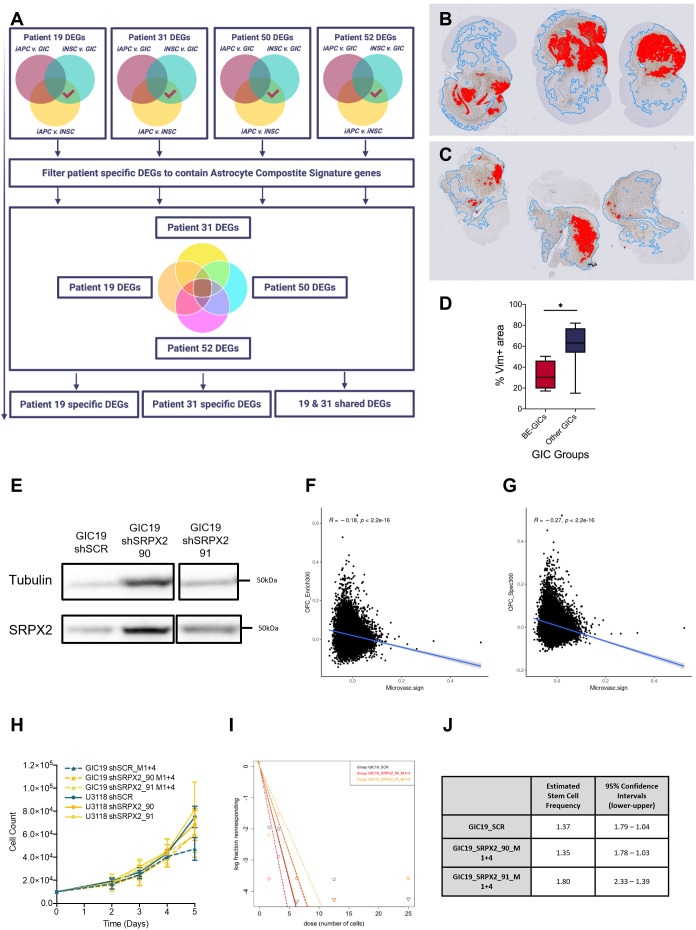
Figure 4. Increased invasion in xenografts derived from BE-GICs and role of SRPX2 in regulating invasion in vitro.
(A) and (B) Representative images of human vimentin-stained xenograft tumours with overlayed image analysis. Red outline is the detected tumour core, blue outline is the detected gross tumour edge. (C) Invasive index scores of xenografts from BE-GICs (N=4) and other GICs (N=8), statistical significance tested using un-paired t-test. (D) Overview of significant differentially expressed genes (DEGs) that are present in the astrocyte composite signature (ACS) and are identified in glioblastoma initiating cell (GIC) versus induced neural stem cell (iNSC) and induced astrocyte progenitor cell (iAPC) versus iNSC comparisons across patient comparisons. (E) Expression (transcripts per million [TPM]) of SRPX2 in the three cell types analysed: iAPC (orange), iNSC (red), and GIC (turquoise). (F) Expression of target genes in glioblastoma tissue (N=528) as compared to non-tumour tissue (N=10), data acquired from Gliovis (Bowman et al., 2017), statistical significance tested using Mann-Whitney t-test. (G) Expression of target genes in BE-GICs (N=13) versus nBE-GICs (N=6) from the HGCC cohort, statistical significance tested using Mann-Whitney t-test. (H) Kaplan-Meier curve for GBM patients with high expression (red) versus low expression (blue) of SRPX2, produced using TCGA data available on Gliovis (Bowman et al., 2017). (I) Relative fold change in mRNA expression of SRPX2 as determined by qPCR for GIC short hairpin RNA (shRNA) knockdown lines, statistical significance tested using t-test (N=3). (J) Representative western blot of SRPX2 in U3118 shRNA knockdown lines. (K) Relative fold change in SRPX2 protein expression as determined by western blot for GIC shRNA knockdown lines, statistical significance tested using t-test (N=3). (L) Invasion assay results: average number of nuclei per image field of GIC SRPX2 knockdown lines, statistical significance tested using two-way ANOVA (N=3-4). (M) Z-score of SRPX2 expression in different tumour regions according to Ivy GAP (Puchalski et al., 2018) (N=19-111). (N) Correlation of ACS enrichment scores (y-axis) and enrichment scores for a signature of the top 200 up-regulated genes in regions of microvascular proliferation and hyperplastic blood vessels (x-axis) in single tumour cells from Pombo Antunes et al., 2021. (O) Neurosphere assay results: log fraction of the number of non-responding cultures at specified cell counts for U3118 SRPX2 knockdown lines. (P) Table of estimated stem cell frequencies and confidence intervals as determined by the neurosphere assay results and extreme limiting dilution assay analysis.


