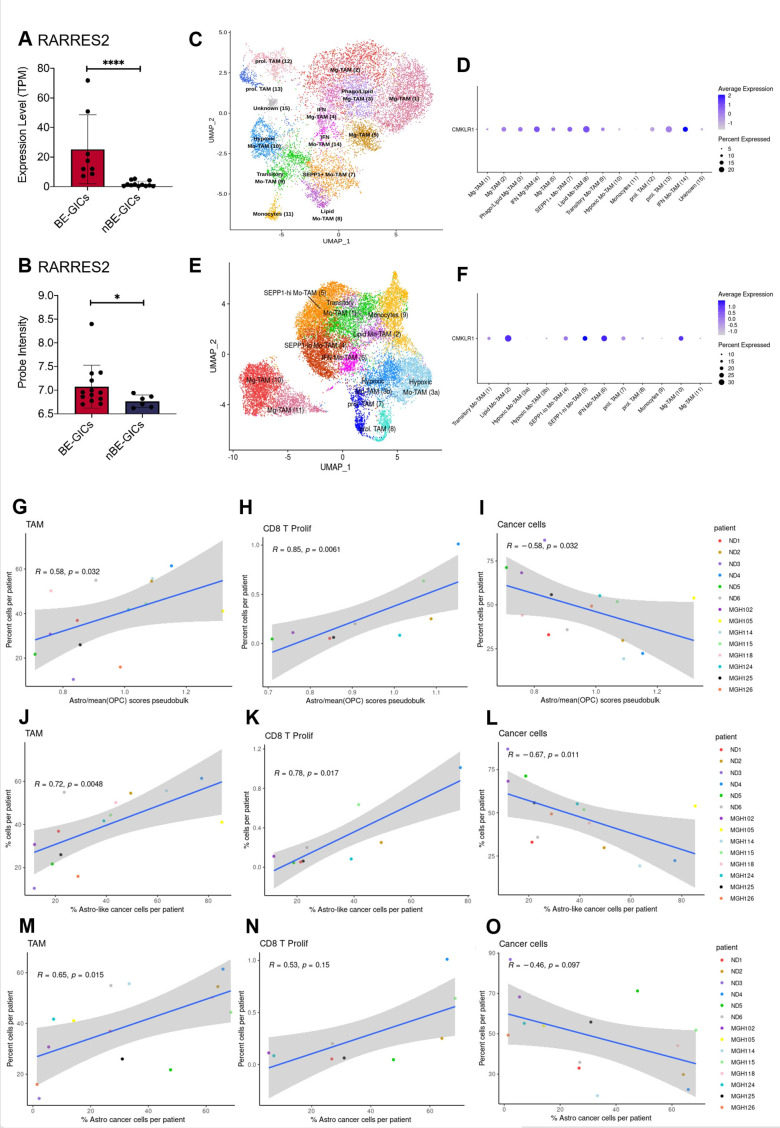
Figure 5. GBM enriched for an astrocytic signature display an altered immune landscape.
(A) Expression of RARRES2 in BE-GICs (N=8) and nBE-GICs (N=12) in our cohort, determined by RNAseq. (B) Expression of RARRES2 in BE-GICs (N=13) and nBE-GICs (N=6) in the HGCC cohort. (C) UMAP of monocyte and tumour-associated macrophage (TAM) cell clusters from the Antunes et al. (Tarazona et al., 2015) newly diagnosed glioblastoma tumour data; the cells are coloured by cell type. (D) Expression of CMKLR1 across different immune cell type clusters from panel (C). (E) UMAP of monocyte and TAM clusters from the Antunes et al. (Tarazona et al., 2015), recurrent glioblastoma tumour data; the cells are coloured by TAM subtype. (F) Expression of CMKLR1 across different TAM subtype clusters from panel (E). Scatter plot, comparing the ratio of the astrocyte composite signature (ACS) and the mean OPC pseudo-bulk enrichment scores, and the proportion of TAM cells (G), CD8 proliferative T cells (H), and cancer cells (I) from the same tumour. Scatter plot, comparing the proportion of ACS-enriched cancer cells and the proportion of TAM cells (J), CD8 proliferative T cells (K), and cancer cells (L) from the same tumour, corresponding to the dataset from (G–I). Scatter plot, comparing the proportion of AC-enriched and the proportion of TAM cells (M), CD8 proliferative T cells (N), and cancer cells (O) from the same tumour, corresponding to the dataset from (G–I). Spearman’s rank correlation coefficient and the corresponding p-value are noted on each scatter plot. The blue lines represent smoothed conditional means using general linear model, while the grey areas on the plots denote the confidence interval around the smooth (using the geom_smooth function of ggplot2).


