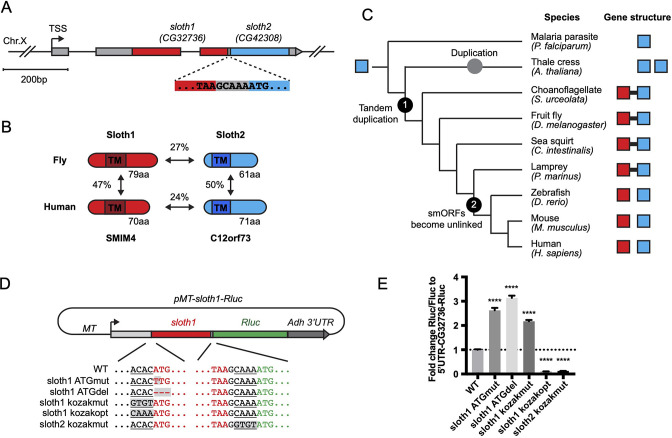
Figure 1. Bicistronic gene structure of the smORFs sloth1 and sloth2.
(A) Bicistronic gene model for sloth1 and sloth2. Zoom in shows intervening sequence (GCAAA) between sloth1 stop codon and sloth2 start codon. (B) Comparison of protein structure, amino acid length size, and amino acid percent identity between Drosophila and Human orthologs. Shaded rectangle indicates predicted transmembrane (TM) domain. (C) Phylogenetic tree of sloth1 and sloth2 orthologs in representative eukaryotic species. Linked gene structure (candidate bicistronic transcript or adjacent separate transcripts) is indicated by a black line connecting red and blue squares. (D) Plasmid reporter structure of pMT-sloth1-Rluc and derivatives. Kozak sequences upstream of start codon are underlined. Mutations indicated with shaded grey box. pMT = Metallothionein promoter. RLuc = Renilla Luciferase. (E) Quantification of RLuc luminescence/Firefly Luciferase, normalized to pMT-sloth1-Rluc, for each construct. Significance of mutant plasmid luminescence was calculated with a T-Test comparing to pMT-sloth1-Rluc. Error bars are mean with SEM. **** p≤0.0001. N=4 biological replicates.


