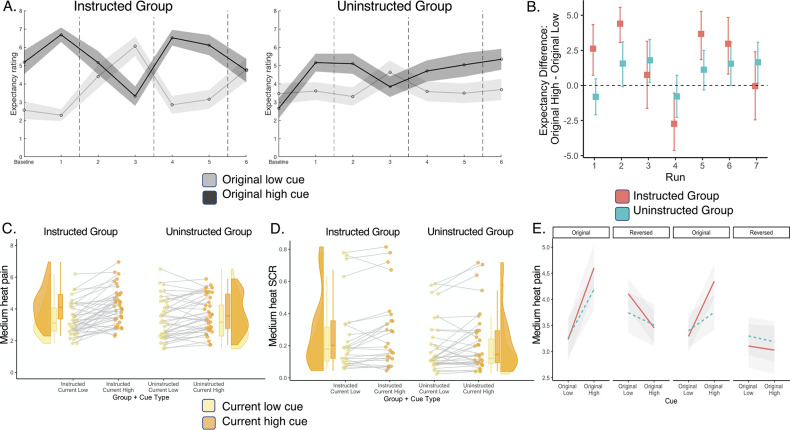
Figure 4. Expectations and pain ratings update as contingencies change.
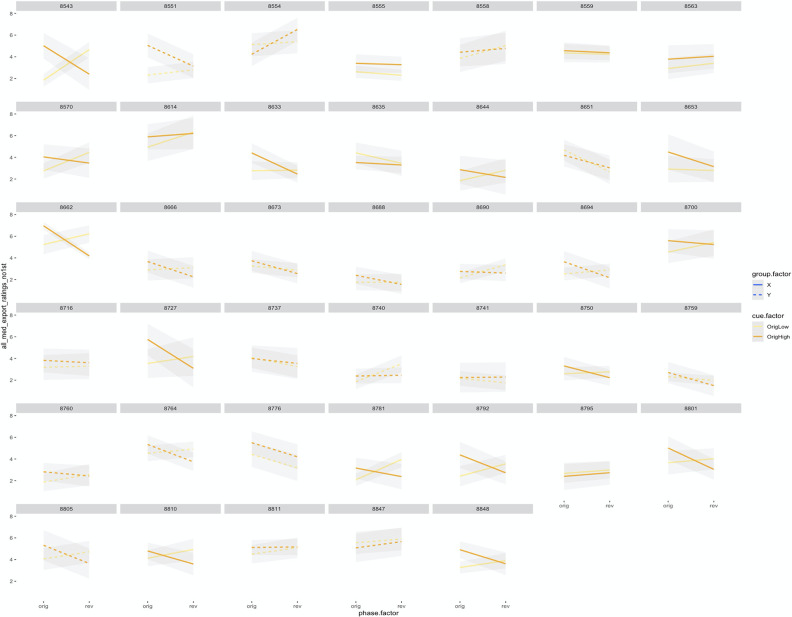
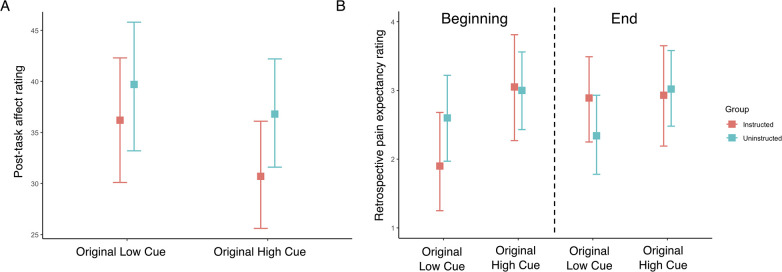
We analyzed cue-based expectations and the effects of cues on pain ratings in response to medium heat across the entire task, including reversals. Reversals were coded relative to instructions in the Instructed Group and relative to experience in the Uninstructed Group (see Figure 1C). (A) Expectancy ratings across the entire task. Both groups updated expectations as contingencies reversed. (B) Cue-based differences in expectancy. The Instructed Group (Red) shows larger differences in expectancy as a function of phase, although both groups show significant Cue x Phase interactions across the task, indicating that both instructions and experiential learning dynamically shape expectations. (C) Effects of current cue contingencies on subjective pain. We analyzed Cue x Phase interactions on pain to evaluate whether individuals report higher pain with the cue that is currently paired with high heat (Original High Cue on original contingency blocks, Original Low Cue on reversed blocks). Both groups reported higher pain when medium heat was paired with the current high cue relative to the current low cue. (D) Effects of current cue contingencies on heat-evoked SCR. Similar to pain, both groups displayed elevated heat-evoked SCR when medium heat was paired with the current high cue relative to the current low cue. (E) Pain reversals are larger in Instructed Group participants. As with expectancy ratings, both groups showed significant reversals of cue effects on subjective pain as contingencies changed, but reversals were larger in Instructed Group participants. Individual participants’ ratings are presented in Figure 4—figure supplement 1 and retrospective ratings are reported in Figure 4—figure supplement 2. Errors and shaded regions denote standard error of the mean (n = 20 per group).


