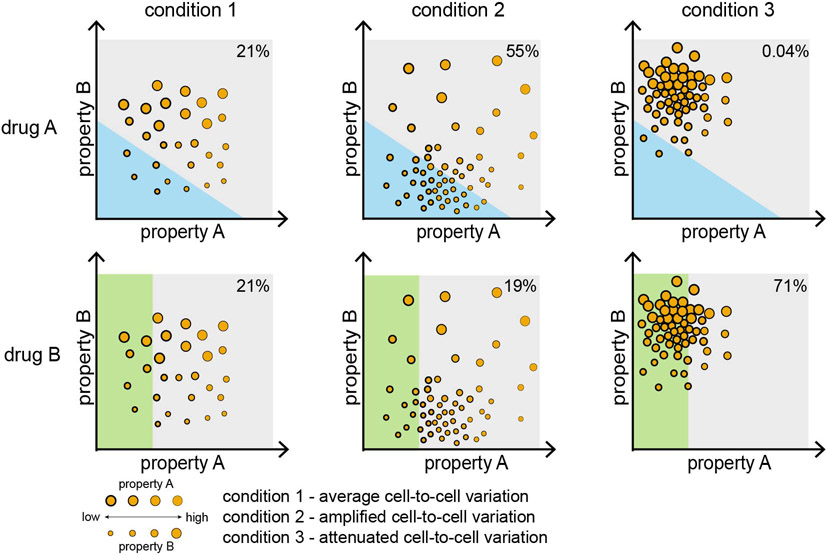
Figure 3. Population structure and complex Mycobacterium tuberculosis phenotypes.
A hypothetical population structure framework maps single-cell and population-level cellular states and phenotypes across multiple processes. The locations, dense regions and spread in this phase diagram change due to adaptation to different environmental conditions, including drug treatment. Each axis (property A and property B) can represent cellular states, such as cell size, gene expression or virulence. Abstracted axes, as being used for illustrative examples here, may be made quantitative using weighted sums of specific cellular features through dimensionality reduction techniques such as principal component analysis. Condition 1 is an example wherein cells are evenly distributed throughout the range of properties A and B. During adaptation to new environments and stressors, the population structure can be shifted and/or concentrated to other regions of the phase diagram. The degree of bacterial heterogeneity can become amplified (condition 2) or attenuated (condition 3). Following antibiotic treatment, the size of the tolerant subpopulation may vary depending on which condition Mycobacterium tuberculosis has adapted to (for example, 21% in condition 1, 55% in condition 2, 0.04% in condition 3 following treatment with drug A). The region that encompasses drug-tolerant cell states will be dependent on the activity and mechanism of action of the drug (compare drug A versus drug B), highlighting that there are different kinds of persister cells.

