Figure 1.

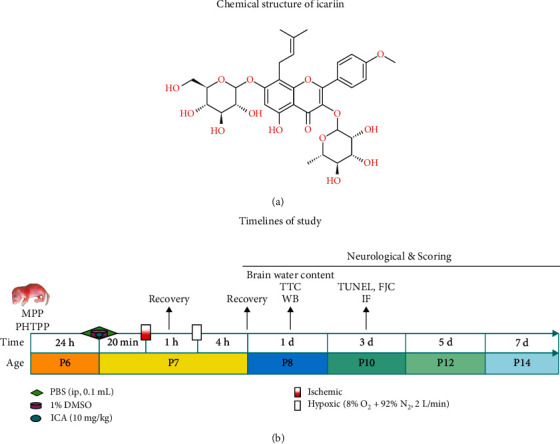
Molecular structure and timelines of the study. (a) Molecular structure of ICA. (b) Timeline for the in vivo studies. P represents the number of days after mouse birth.

Molecular structure and timelines of the study. (a) Molecular structure of ICA. (b) Timeline for the in vivo studies. P represents the number of days after mouse birth.