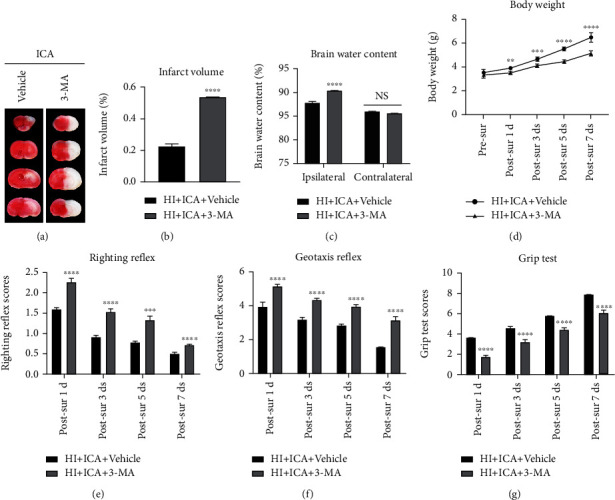
Figure 4.

Effects of the autophagy inhibitor 3-MA on cerebral infarction volume, cerebral water content, and neurological function in HIBD newborn mice. (a) TTC staining photos of brain tissue sections, n = 6 in each group. (b) Quantitative analysis of TTC staining showing cerebral infarct volume. (c) Quantitative analysis of the brain water content in neonatal mice with HIBD, n = 6 in each group. (d) Quantitative analysis of body weight measurements, (e) positive righting reflex, (f) negative geotaxis reflex, and (g) grip tests on days 1, 3, 5, and 7 after HIBD in neonatal mice, n = 8 mice in each group. ∗∗P < 0.01, ∗∗∗P < 0.001, and ∗∗∗∗P < 0.0001 compared to the HI + ICA + Vehicle group, NS = no significant difference. Data are expressed as the mean ± SDs.
