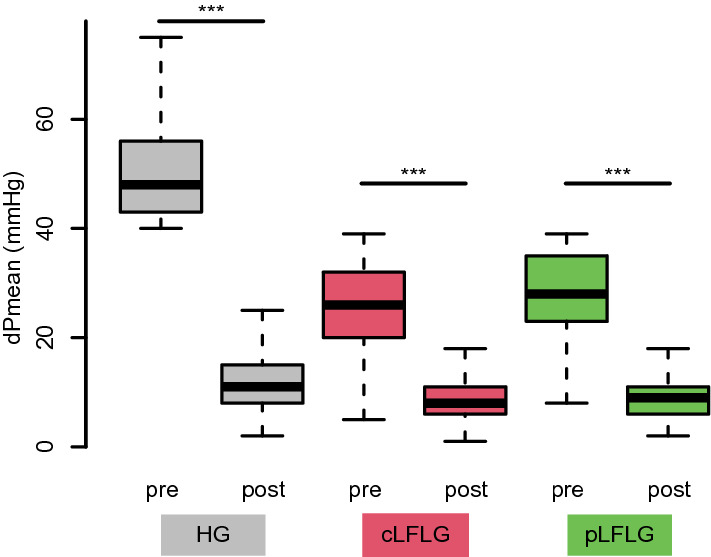
Fig. 3.

Mean transvalvular pressure gradients before and after TAVI The graph depicts the mean transvalvular pressure gradients before TAVI and at follow-up for each group. Mean pressure gradients were 48 [43–56] mmHg before and 11 [8–15] mmHg after TAVI for HG, 26 [20–32] mmHg before and 8 [6–11] mmHg after TAVI for cLFLG, and 28 [23–35] mmHg before and 9 [6–12] mmHg after TAVI for pLFLG. There was a significant reduction of dPmean after TAVI in all three groups (p < 0.01 for all). cLFLG classical low-flow low-gradient, dPmean mean transvalvular pressure gradients, HG high gradient, pLFLG paradoxical low-flow low-gradient, TAVI transcatheter aortic valve implantation
