Fig. 4.
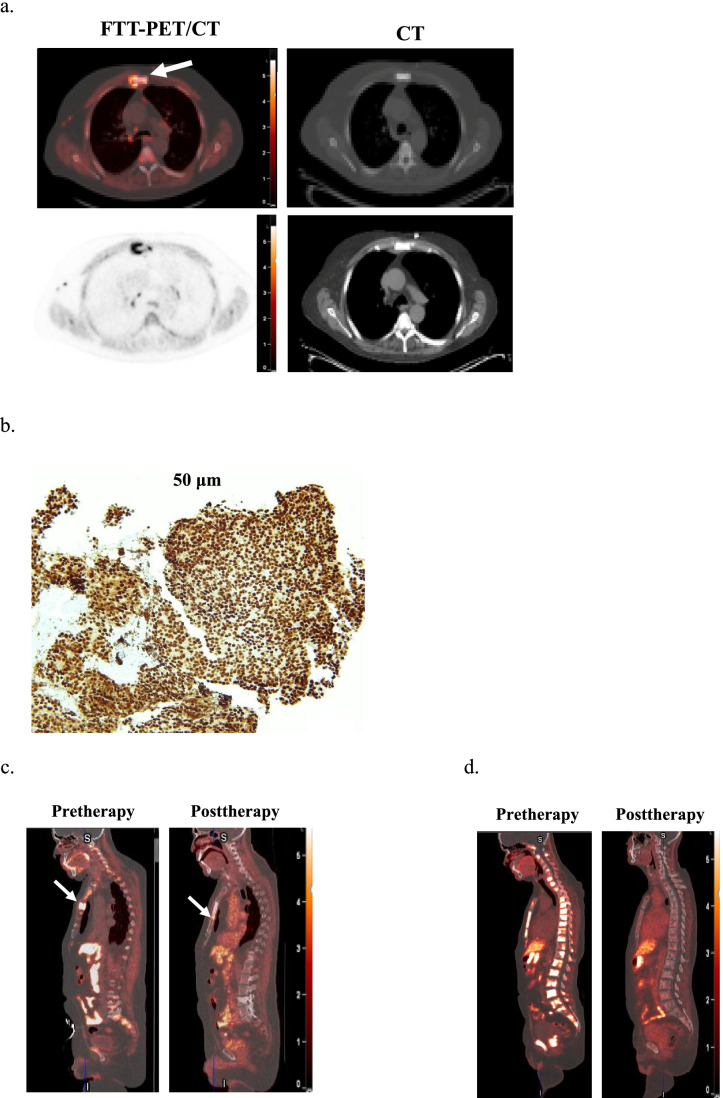
Prostate adenocarcinoma (#6). A Fused FTT-PET/CT (left top row) and CT (right: top, bone window; bottom, soft tissue window) images. There is FTT + sternal metastasis (arrows) with slightly different distribution. Additional FTT + mediastinal lymph nodes are noted. B PARP1 IHC score of 8. C Fused FTT-CT sagittal images of before and 4 months after PARPi therapy (#6 non-responder). The post-therapy image demonstrates the resolution of the sternal lesion (arrow) seen on pre-therapy image and appearance of a new sternal lesion just inferior to the initial lesion (arrow). D Fused FTT-CT sagittal images of before and 4 months after PARPi therapy (#8 responder). The post-therapy image demonstrates near-complete resolution of all spine and sternal metastatic disease. The scale bar on PET images: SUVmax = 5.5

